 | Show/Hide. Show (or hide) the data filtering options. |
 | Refresh. Refresh tree view • Stop Automatically Refreshing Dataset Tree View. |
 | Queue. Open the print queue. See Print Queue for more information. |
 | Delta. Generate Delta/special-type grid-binned metrics. See Delta/Special -type Grid-binned Metrics for more information. |
 | Unpack. Unpack a TEMS Discovery packed dataset. |
 | Composite options: • Modify Dynamic Composite Dataset Scope. Modify restrictions for applying the rules defined in dynamic composite dataset to current project. See Modify Dynamic Composite Dataset Scope for more information. |
 | Group. Create dataset group. |
 | Help. |


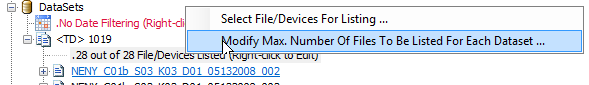
 to refresh the Dataset tree view after any change to the selection of problem sets. This option only affects the dataset listing in the Data Explorer. to refresh the dataset tree view after any change to the date criteria. This option only affects the dataset listing in the Data Explorer.
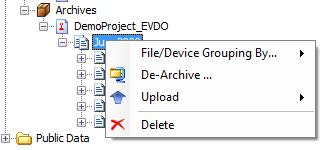 | File/Device Grouping By. Group mobile data by its File Name, Device, ESN, IMEI, Label, or Mobile ID, or by any user-defined attributes. See Device Attribute Assignment. De-Archive. De-archive the dataset so that it will be listed under the logical group Datasets. Upload. Uploads the item to the Public Data Folder. Delete. Delete the archived dataset permanently from the disk. |
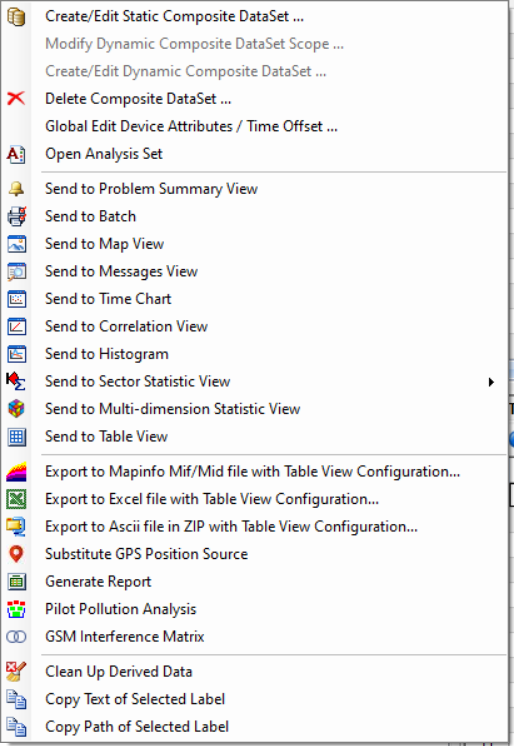
Create/Edit Static Composite Dataset. Open the Create/Edit Static Composite Dataset dialog. See Static Composite Dataset. Modify Dynamic Composite Dataset Scope. Open the Modify Dynamic Composite Dataset Scope dialog. See Modify Dynamic Composite Dataset Scope. Create/Edit Dynamic Composite Dataset. Open the Create/Edit Dynamic Composite Dataset dialog. See Dynamic Composite Dataset. Delete Composite Dataset. Delete the selected composite dataset. Global Edit Device Attributes/Time Offset. Globally edit the attributes of all the devices that are members of the selected composite dataset. See Device Attribute Assignment. |
Open Analysis Set. Construct a new view layout and load data from the selected composite dataset based on the pre-defined analysis sets. Send to Problem Summary View. Select a problem set template (which can be defined in the Report Template Builder) to generate a report of the problem from the selected composite dataset, and then display the problem report in the Problem Summary View. Send to Batch. Send to Map View. Load data from the selected composite dataset based on the pre-defined configuration to the Map View. Send to Messages View. Load data from the selected composite dataset based on the pre-defined configuration to the Messages View. Send to Time Chart. Load data from the selected composite dataset based on the pre-defined configuration to the Time Chart. Send to Correlation View. Load data from the selected composite dataset based on the pre-defined configuration to the Correlation View. Send to Histogram. Load data from the selected composite dataset based on the pre-defined configuration to the Histogram. Send to Sector Statistics View. Load data from the selected composite dataset based on the pre-defined configuration to the Sector Statistics View. Send to Multi-dimension Statistic View. Load data from the selected composite dataset based on the pre-defined configuration to the Multi-dimension Statistic View. Send to Table View. Load data from the selected composite dataset based on the pre-defined configuration to the Table View. Export to MapInfo Mif/Mid file with Table View Configuration. Export data from the selected composite dataset based on the pre-defined Table View configuration to MapInfo Mif/Mid files. Export to Excel with Table View Configuration. Export data from the selected composite dataset based on the pre-defined Table View configuration to an Excel file. Export to ASCII file in ZIP with Table View Configuration. Export data from the selected composite dataset based on the pre-defined Table View configuration to ASCII files and compresses them to a ZIP file. Substitute GPS Position Source. Manual trigger of Enhanced Substitution of GPS Position Source for selected composite dataset and user-configured Substitute GPS Position Source configuration. Generate Report. Generate a report from the selected composite dataset based on the pre-defined report template, and send the result to Excel. Pilot Pollution Analysis. Run Pilot Pollution Analysis on the selected composite dataset. GSM Interference Matrix. Generate a GSM Interference Matrix on the selected composite dataset. Clean Up Derived Data. Clean up the data that is not generated frpcaom data importing, thus releasing disk space. Copy Text of Selected Label. Copy the text of the selected tree node to the Clipboard, so that you can paste the text to an external tool such as Notepad or Excel for any purpose. Copy Path of Selected Label. Copy the path of the selected tree node to the Clipboard, so that you can paste the path to an external tool such as Notepad or Excel for any purpose. |
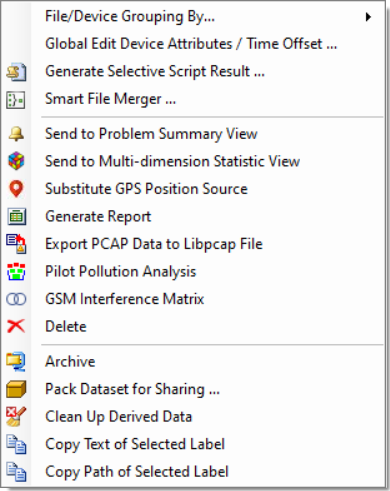
File/Device Grouping By. Group mobile data by its File Name, Device, ESN, IMEI, Label, or Mobile ID, or by any user-defined attributes. See Device Attribute Assignment. Global Edit Device Attributes/Time Offset. Globally edit the attributes of all the devices that are members of the selected dataset. See Device Attribute Assignment. Smart File Merger. Automatically merge all the files in the selected dataset, if the gap between any two files is less than or equal to the defined gap, and their IMSIs are the same if any of them has IMSI information. In case both of them do not have IMSI information, then check their IMEI, then ESN, and then device type. Send to Problem Summary View. Bring up a dialog for selecting a problem set template (defined in the Report Template Builder) to generate a report of problems from the selected dataset, and then display the problem report in the Problem Summary View. Send to Multi-dimension Statistic View. Load data from the selected dataset based on the pre-defined configuration to the Multi-dimension Statistic View. Substitute GPS Position Source. Manual trigger of Enhanced Substitution of GPS Position Source for selected dataset and user-configured Substitute GPS Position Source configuration. Generate Report. Generate a report from the selected dataset based on the pre-defined report template, and send the result to Excel. Export PCAP Data to Libpcap file. Generates IP data stream export for selected dataset. Export is generated per individual file/device (using respective file/device name in <file name>_<device name> format) to user specified folder. Same type of export can be generated from right click context menu of composite dataset PCap data frame or individual file/device. GSM Interference Matrix. Generate a GSM Interference Matrix on the selected dataset. Delete. Delete the selected dataset. Archive. Archive the selected dataset. The archived dataset will then be listed under the Archive tree node. Pack Dataset for Sharing. Export the selected dataset to a ZIP file for archiving or sharing. Clean Up Derived Data. Clean up the data that is not generated from data importing, thus releasing disk space. Copy Text of Selected Label. Copy the text of the selected tree node to the Clipboard, so that you can paste the text to an external tool such as Notepad or Excel for any purpose. Copy Path of Selected Label. Copy the path of the selected tree node to the Clipboard, so that you can paste the path to an external tool such as Notepad or Excel for any purpose. |
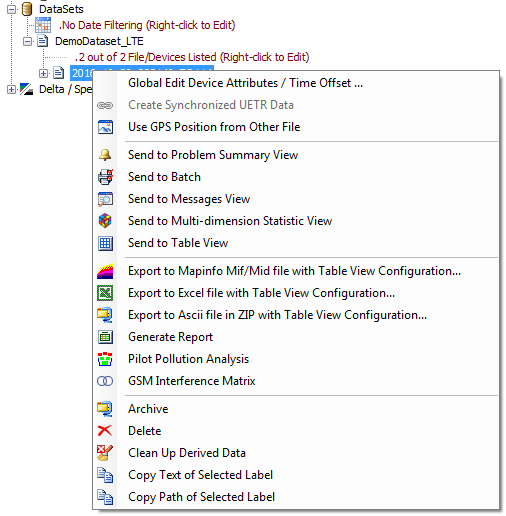 |
Global Edit Device Attributes / Time Offset. Globally edit the attributes of all the devices that are members of the selected mobile group. See Device Attribute Assignment. **Use GPS Position from Other File. Send to Problem Summary View. Select a problem set template (defined in the Report Template Builder) to generate a report of problems from the selected mobile group, and then display the problem report in Problem Summary View. **Send to Batch. Load data from the selected mobile group and display a summary PDF based on the pre-defined configuration in Batch PDF View. Send to Messages View. Display the selected mobile groups to the Messages View. Send to Multi-dimension Statistic View. Load data from the selected mobile group based on the pre-defined configuration to the Multi-dimension Statistic View. Send to Table View. Load data from the selected mobile group based on the pre-defined configuration to the Table View. Export to MapInfo Mif/Mid file with Table View Configuration. Export data from the selected mobile group based on the pre-defined Table View configuration to MapInfo Mif/Mid files. Export to Excel file with Table View Configuration. Export data from the selected mobile group based on the pre-defined Table View configuration to Excel files. Export to ASCII file in ZIP with Table View Configuration. Export data from the selected mobile group based on the pre-defined Table View configuration to ASCII files and compress them to a ZIP file. Generate Report. Generate a report from the selected mobile group based on the pre-defined report template and send the result to Excel. GSM Interference Matrix. Generate a GSM Interference Matrix on the selected mobile group. Archive. Archive the selected mobile group. The archived mobile can then be listed under the Archive tree node. Delete. Delete the selected mobile group. Clean Up Derived Data. Clean up the data that is not generated from data importing, thus releasing disk space. Copy Text of Selected Label. Copy the text of the selected tree node to the Clipboard, so that you can paste the text to an external tool such as Notepad or Excel for any purpose. Copy Path of Selected Label. Copy the path of the selected tree node to the Clipboard, so that you can paste the path to an external tool such as Notepad or Excel for any purpose. |
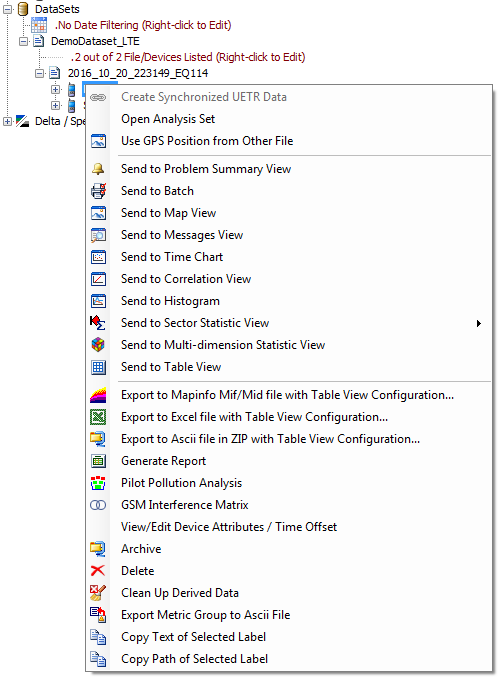 | |
Open Analysis Set. Construct a new view layout and load data from the selected mobile data based on the pre-defined analysis sets. **Use GPS Position from Other File Send to Problem Summary View. Bring up a dialog for selecting a problem set template (defined in the Report Template Builder) to generate a report of problems from the selected mobile, and then display the problem report in Problem Summary View. **Send to Batch. Bring up a dialog for selecting a summary view option to generate a summary PDF from the selected device, and then display the PDF in Batch PDF View. Send to Map View. Load data from the selected mobile based on the pre-defined configuration to the Map View. Send to Messages View. Display the selected mobile to the Messages View. Send to Time Chart. Load data from the selected mobile based on the pre-defined configuration to the Time Chart. Send to Correlation View. Load data from the selected mobile based on the pre-defined configuration to the Correlation View. Send to Histogram. Load data from the selected mobile based on the pre-defined configuration to the Histogram. Send to Sector Statistics View. Load data from the selected mobile based on the pre-defined configuration to the Sector Statistics View. Send to Multi-dimension Statistic View. Load data from the selected mobile based on the pre-defined configuration to the Multi-dimension Statistic View. Send to Table View. Load data from the selected mobile based on the pre-defined configuration to the Table View. Export to MapInfo Mif/Mid file with Table View Configuration. Export data from the selected mobile based on the pre-defined Table View configuration to MapInfo Mif/Mid files. Export to Excel file with Table View Configuration. Export data from the selected mobile based on the pre-defined Table View configuration to Excel files. Export to ASCII file in ZIP with Table View Configuration. Export data from the selected mobile based on the pre-defined Table View configuration to ASCII files and compress them to a ZIP file. Generate Report. Generate a report from the selected mobile based on the pre-defined report template and send the result to Excel. Pilot Pollution Analysis. Run Pilot Pollution Analysis on the selected mobile. GSM Interference Matrix. Generate a GSM Interference Matrix on the selected mobile. View/Edit Device Attributes/Time Offset. View and edit the selected mobile's device information. See Device Attribute Assignment. Archive. Archive the selected mobile. The archived mobile can then be listed under the Archive tree node. Delete. Delete the selected mobile data. Clean Up Derived Data. Clean up the data that is not generated from data importing, thus releasing disk space. Export Metric Group to ASCII File. Export the data of the selected metric group to an ASCII file. Copy Text of Selected Label. Copy the text of the selected tree node to the Clipboard, so that you can paste the text to an external tool such as Notepad or Excel for any purpose. Copy Path of Selected Label. Copy the path of the selected tree node to the Clipboard, so that you can paste the path to an external tool such as Notepad or Excel for any purpose. | |
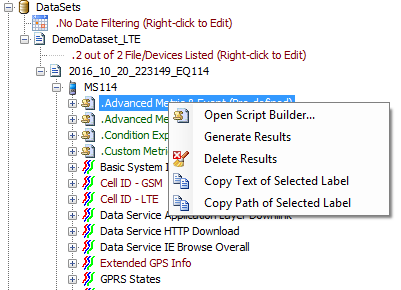 |
Open Script Builder. Open the Script Builder. Generate Results. Run all the scripts under the selected script category, and generate results for each script. Delete Results. Delete the result of all scripts under the selected script category. Copy Text of Selected Label. Copy the text of the selected tree node to the Clipboard, so that you can paste the text to an external tool such as Notepad or Excel for any purpose. Copy Path of Selected Label. Copy the path of the selected tree node to the Clipboard, so that you can paste the path to an external tool such as Notepad or Excel for any purpose. |
 |
Add to favorite. Add the selected script to the pre-defined favorite group. Remove from favorite. Remove the selected script from the current favorite group. Open Script Builder. Open the Script Builder. Generate Result. Generate results for the selected script. Delete Result. Delete the results generated by the script. Send to Messages View. Execute the selected script and display the result in the Messages View. Copy Text of Selected Label. Copy the text of the selected tree node to the Clipboard, so that you can paste the text to an external tool such as Notepad or Excel for any purpose. Copy Path of Selected Label. Copy the path of the selected tree node to the Clipboard, so that you can paste the path to an external tool such as Notepad or Excel for any purpose. |
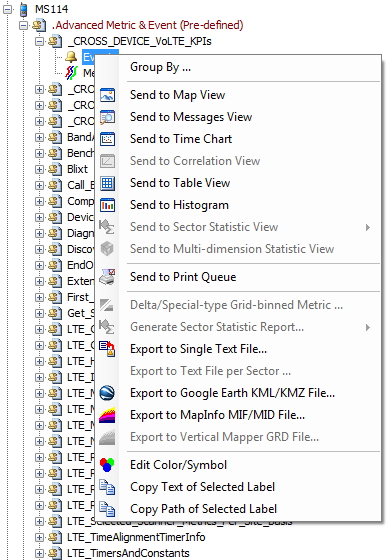 |
Group By. Events can be grouped event category, which is the default, or by event priority, or by one of the report variables. Event priority and report variables are defined when you create a script. 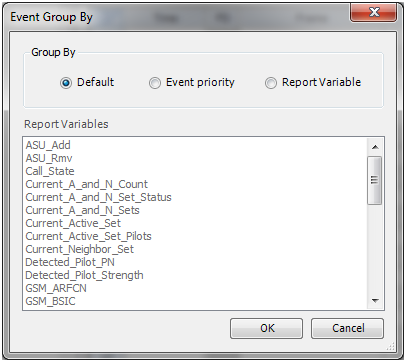 Send to Map View. Execute the script and display all events in the Map View. Send to Messages View. Execute the script and display all events in the Messages View. Send to Time Chart. Execute the script and display all events in the Time Chart. Send to Correlation View. Not applicable. Send to Table View. Execute the script and display all events in the Table View. Send to Histogram. Execute the script and display all events in the Histogram. Send to Sector Statistic View. Not applicable. Send to Multi-dimension Statistic View. Not applicable. Send to Print Queue. Execute the script and send to Print Queue. Delta/Special-type Grid-binned Metric. Not applicable. Generate Sector Statistics Report. Execute the script and generate a statistic report per sector. Export to Single Text File. Execute the script and export all events to a text file. Export to Text File per Sector. Execute the script and export all events to a text file per sector. Export to Google Earth KMZ file. Export the selected metric to a KMZ file that can be displayed in Google Earth or any other tools that support KMZ files. Export may be generated with ‘Absolute altitude’ or ‘Clamp to ground’ height modes, and with standard (Point) or LineString geometries. All KMZ export is generated with metric/event legend information (supported in GE Pro version only) in all 4 corners of GE map view so one with appropriate placement can be enabled using GE data tree selection. Export to MapInfo MIF/MID File. Execute the script and export all events to a MapInfo MIF/MID file. Export to Vertical Mapper GRD File. Not applicable. Edit Color/Symbol. Open the Plot Band Definition dialog and edit the color/symbol for the selected event. Copy Text of Selected Label. Copy the text of the selected tree node to the Clipboard, so that you can paste the text to an external tool such as Notepad or Excel for any purpose. Copy Path of Selected Label. Copy the path of the selected tree node to the Clipboard, so that you can paste the path to an external tool such as Notepad or Excel for any purpose. |
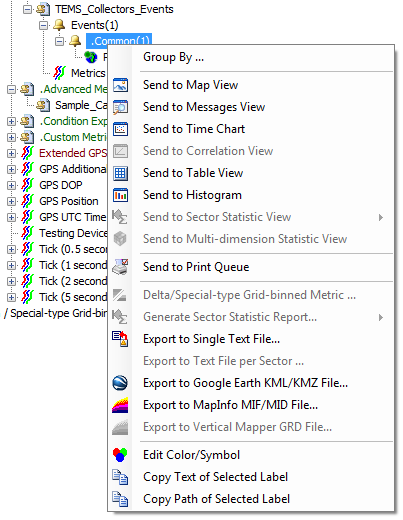 |
Group By. Events can be grouped event category, which is the default, or by event priority, or by one of the report variables. Event priority and report variables are defined when you create a script. Send to Map View. Execute the script and display events of the selected category in the Map View. Send to Messages View. Execute the script and display all events of the selected category in the Messages View. Send to Time Chart. Execute the script and display events of the selected category in the Time Chart. Send to Correlation View. Not applicable. Send to Table View. Execute the script and display events of the selected category in the Table View. Send to Histogram. Execute the script and display events of the selected category in the Histogram. Send to Sector Statistic View. Not applicable. Send to Multi-dimension Statistic View. Not applicable. Send to Print Queue. Execute the script and send to Print Queue. Delta/Special-type Grid-binned Metric. Not applicable. Generate Sector Statistics Report. Not applicable. Export to Single Text File. Execute the script and export events of the selected category to a text file. Export to Text File per Sector. Execute the script and export events of the selected category to a text file per sector. Export to Google Earth KMZ File. Execute the script and export events of the selected category to a Google Earth KMZ file. Export may be generated with ‘Absolute altitude’ or ‘Clamp to ground’ height modes, and with standard (Point) or LineString geometries. All KMZ export is generated with metric/event legend information (supported in GE Pro version only) in all 4 corners of GE map view so one with appropriate placement can be enabled using GE data tree selection. Export to MapInfo MIF/MID File. Execute the script and export events of the selected category to a MapInfo MIF/MID file. Export to Vertical Mapper GRD File. Not applicable. Edit Color/Symbol. Open the Plot Band Definition dialog and edit the color/symbol for the selected event category. Copy Text of Selected Label. Copy the text of the selected tree node to the Clipboard, so that you can paste the text to an external tool such as Notepad or Excel for any purpose. Copy Path of Selected Label. Copy the path of the selected tree node to the Clipboard, so that you can paste the path to an external tool such as Notepad or Excel for any purpose. |
|
Open Analysis Set. Execute the script and open the associated analysis set. Send to Map View. Execute the script and display the selected event in the Map View. Send to Messages View. Execute the script and display the selected event in the Messages View. Send to Time Chart. Execute the script and display the selected event in the Time Chart. Send to Correlation View. Not applicable. Send to Table View. Execute the script and display the selected event in the Table View. Send to Histogram. Not applicable. Send to Sector Statistic View. Execute the script and display the selected event in Sector Statistic View. Send to Multi-dimension Statistic View. Execute the script and display the selected event in Multi-dimension Statistic View. Send to Print Queue. Execute the script and send to Print Queue. Delta/Special-type Grid-binned Metric. Not applicable. Generate Sector Statistics Report. Execute the script and generate a Sector Statistics Report for the selected event to a text file. Export to Single Text File. Execute the script and export the selected event to a text file. Export to Text File per Sector. Execute the script and export the selected event to a text file per sector. Export to Google Earth KMZ File. Execute the script and export events of the selected event to a Google Earth KMZ file. Export may be generated with ‘Absolute altitude’ or ‘Clamp to ground’ height modes, and with standard (Point) or LineString geometries. All KMZ export is generated with metric/event legend information (supported in GE Pro version only) in all 4 corners of GE map view so one with appropriate placement can be enabled using GE data tree selection. Export to MapInfo MIF/MID File. Execute the script and export events of the selected event to a MapInfo MIF/MID file. Export to Vertical Mapper GRD File. Not applicable. Edit Color/Symbol. Open the Plot Band Definition dialog and edit the color/symbol for the selected event. Copy Text of Selected Label. Copy the text of the selected tree node to the Clipboard, so that you can paste the text to an external tool such as Notepad or Excel for any purpose. Copy Path of Selected Label. Copy the path of the selected tree node to the Clipboard, so that you can paste the path to an external tool such as Notepad or Excel for any purpose. |
 |
Send to Map View. Execute the script and display the selected metric in the Map View. Send to Time Chart. Execute the script and display the selected metric in the Time Chart. Send to Correlation View. Not applicable. Send to Table View. Execute the script and display the selected metric in the Table View. Send to Histogram. Execute the script and display the selected metric in the Histogram. Send to Sector Statistic View. Execute the script and display the selected metric in the Sector Statistic View. Send to Multi-dimension Statistic View. Execute the script and display the selected metric in the Multi-dimension Statistic View. Send to Print Queue. Execute the script and send to Print Queue. Delta/Special-type Grid-binned Metric. Generate Delta/Special-Type Grid-Binned Metric. Generate Sector Statistics Report. Execute the script and generate a Sector Statistics Report for the selected metric to a text file. Export to Single Text File. Execute the script and export the selected metric to a text file. Export to Text File per Sector. Execute the script and export the selected metric to a text file per sector. Export to Google Earth KMZ File. Execute the script and export events of the selected metric to a Google Earth KMZ file. Export may be generated with ‘Absolute altitude’ or ‘Clamp to ground’ height modes, and with standard (Point) or LineString geometries. All KMZ export is generated with metric/event legend information (supported in GE Pro version only) in all 4 corners of GE map view so one with appropriate placement can be enabled using GE data tree selection. Export to MapInfo MIF/MID File. Execute the script and export events of the selected metric to a MapInfo MIF/MID file. Export to Vertical Mapper GRD File. Not applicable. Edit Plot Band. Open the Plot Band Definition dialog and edit the plot band for the selected metric. Copy Text of Selected Label. Copy the text of the selected tree node to the Clipboard, so that you can paste the text to an external tool such as Notepad or Excel for any purpose. Copy Path of Selected Label. Copy the path of the selected tree node to the Clipboard, so that you can paste the path to an external tool such as Notepad or Excel for any purpose. |
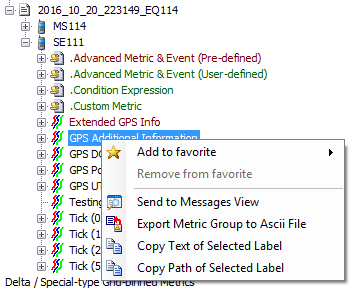 |
Add to favorite. Add the selected frame to the pre-defined favorite group. Remove from favorite. Remove the selected frame from the current favorite group. Send to Messages View. Display the selected frame in the Messages View. Export Metric Group to ASCII File. Export the selected frame to a text file. Copy Text of Selected Label. Copy the text of the selected tree node to the Clipboard, so that you can paste the text to an external tool such as Notepad or Excel for any purpose. Copy Path of Selected Label. Copy the path of the selected tree node to the Clipboard, so that you can paste the path to an external tool such as Notepad or Excel for any purpose. |
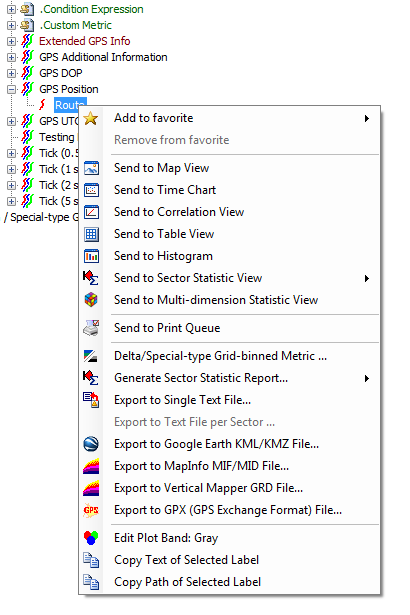 |
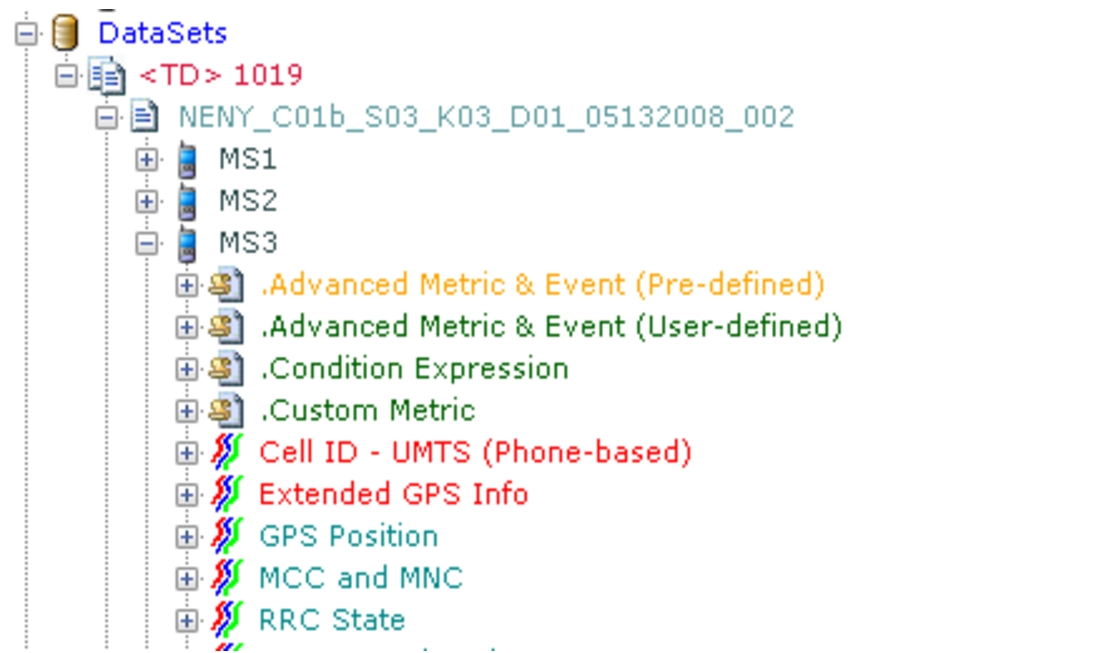
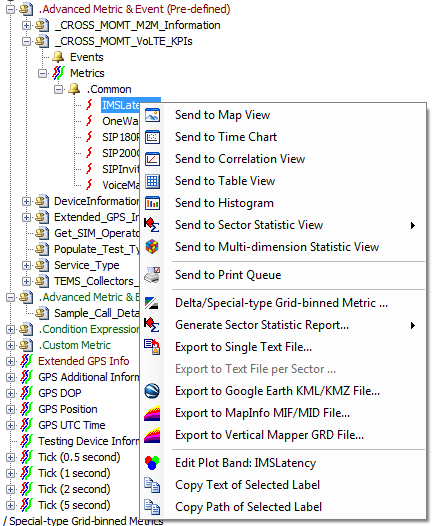
Add to favorite. Add the selected metric to the pre-defined favorite group. Remove from favorite. Remove the selected metric from the current favorite group. Send to Map View. Display the selected metric in the Map View. Send to Time Chart. Display the selected metric in the Time Chart. Send to Correlation View. Load data from the selected dataset based on the pre-defined configuration to the Correlation View. Send to Table View. Display the selected metric in the Table View. Send to Histogram. Display the selected metric in the Histogram. Send to Sector Statistic View. Display the selected metric in the Sector Statistic View. Send to Multi-dimension Statistic View. Display the selected metric in the Multi-dimension Statistic View. Send to Print Queue. See Print Queue for more information. Delta/Special-type Grid-binned Metric. Generate Delta/Special -type Grid-binned Metrics. Generate Sector Statistics Report. Generate a Sector Statistics Report for the selected metric to a text file. Export to Single Text File. Export the selected metric to a text file. Export to Text File per Sector. Export the selected metric to a text file per sector. Export to Google Earth KMZ file. Export the selected metric to a KMZ file that can be displayed in Google Earth or any other tools that support KMZ files. Export may be generated with ‘Absolute altitude’ or ‘Clamp to ground’ height modes, and with standard (Point) or LineString geometries. All KMZ export is generated with metric/event legend information (supported in GE Pro version only) in all 4 corners of GE map view so one with appropriate placement can be enabled using GE data tree selection. Export to MapInfo MIF/MID File. Execute the selected metric to a MapInfo MIF/MID file. Export to Vertical Mapper GRD File. Execute the selected metric to a Vertical Mapper GRD file. Export to GPX (GPS Exchange Format) File. Execute the selected metric (Route in GPS Position) to a GPX (GPS exchange format) file. This file can be imported into any software applications that support common GPS data format to describe the drive test route. Edit Plot Band. Open the Plot Band Definition dialog and edit the plot band for the selected metric. Copy Text of Selected Label. Copy the text of the selected tree node to the Clipboard, so that you can paste the text to an external tool such as Notepad or Excel for any purpose. Copy Path of Selected Label. Copy the path of the selected tree node to the Clipboard, so that you can paste the path to an external tool such as Notepad or Excel for any purpose. |
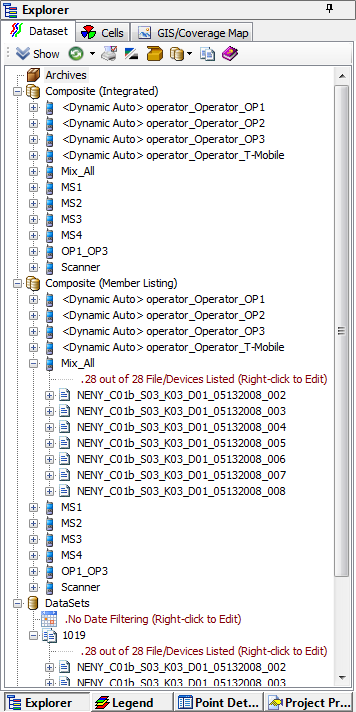
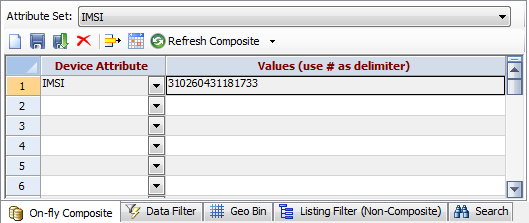
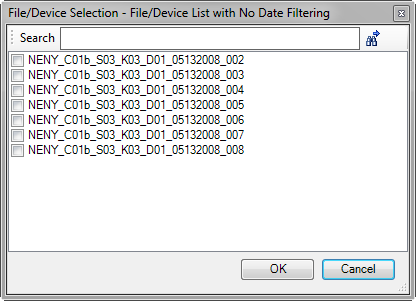
button on the Data Explorer–Dataset toolbar.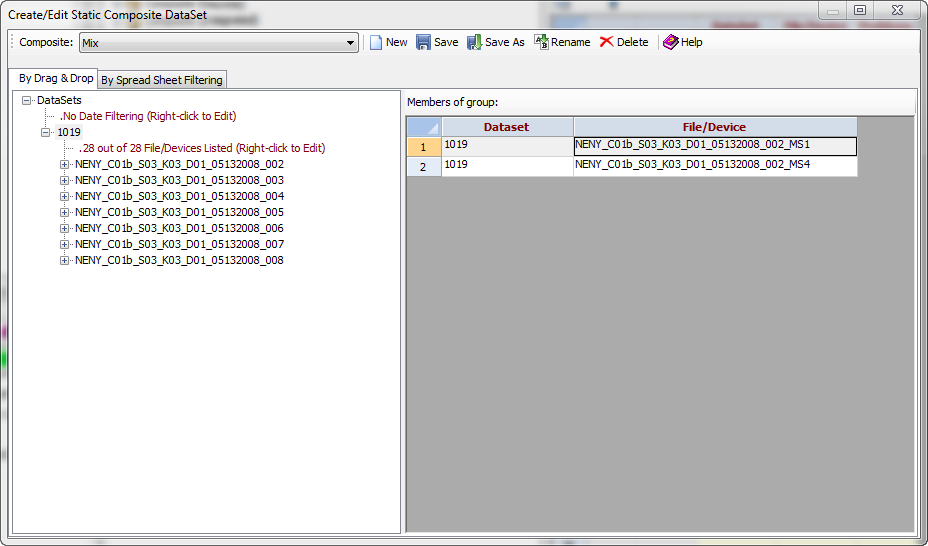 in the toolbar. As with Microsoft Office Excel, you can use the row filtering function to filter out the unwanted data by a particular attribute, and then check the checkboxes to select the data.
 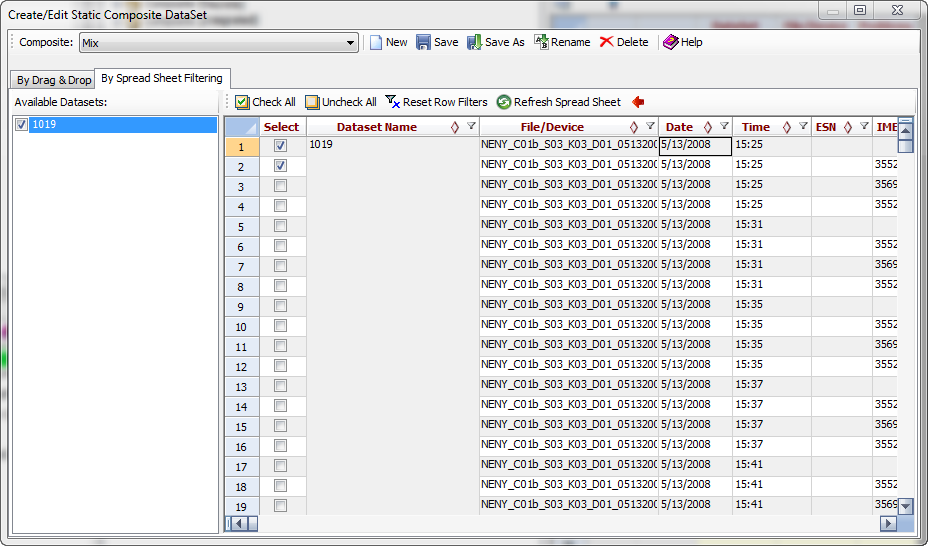 button in the Data Explorer–Dataset toolbar.
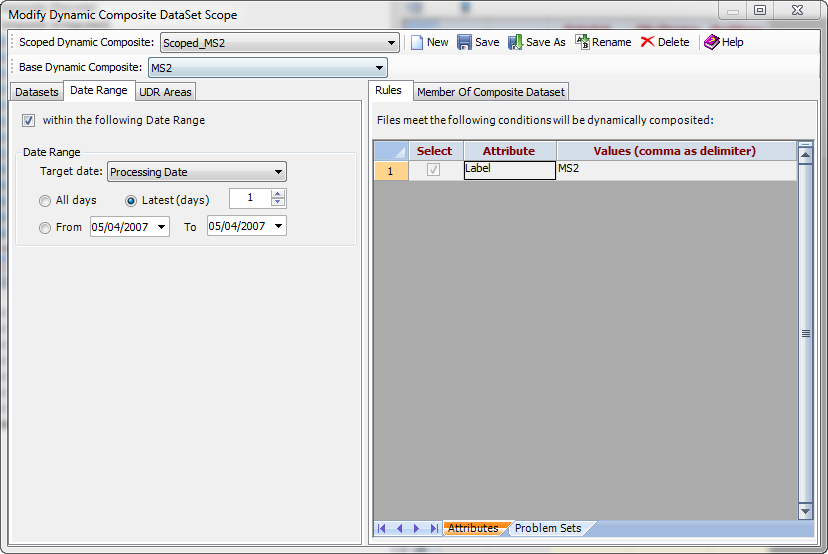 button in the Data Explorer–Dataset toolbar.
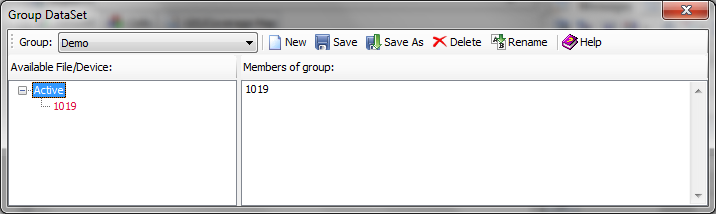
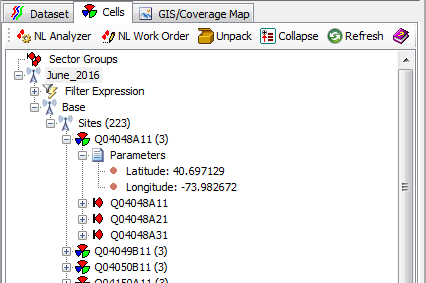
 | NL Analyzer. See Neighbor List Analyzer. |
 | NL Work Order. See Neighbor List Work Order. |
| Unpack. Unpack a TEMS Discovery packed cell configuration. |
 | Collapse. Collapse tree view. |
 | Refresh. |
| Help. |
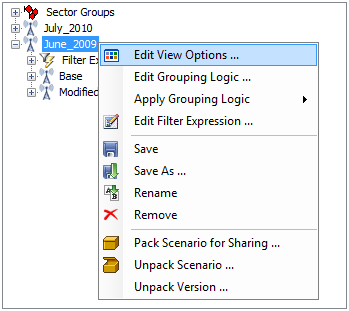 | |
Edit View options. Open the Cell Configuration View Options dialog. The data structure used as the view options is based on the "Base" version of the selected cell configuration. Edit Grouping Logic. Open the Cell Site Grouping Logic dialog. The data structure used as the group categories is based on the "Base" version of the selected cell configuration. Apply Grouping Logic. Apply pre-defined group logic to the logical display of all versions of the selected cell configuration. Edit Filter Expression. Open the . The data structure used as parameters is based on the "Base" version of the selected cell configuration. Save. Save the selected scenario. Save As. Save the selected scenario as a new scenario. Rename. Rename the selected scenario. Remove. Remove the selected scenario. Pack Scenario for Sharing. Pack the selected scenario to a ZIP file. This ZIP file can be shared with peers and unpacked to other projects. Unpack Scenario. Import a TEMS Discovery exported scenario. Unpack Version. Import a TEMS Discovery exported scenario version. | |
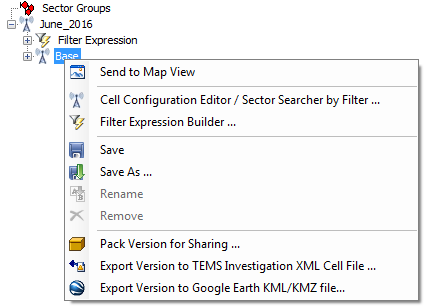 |
Send to Map View. Display the selected scenario version in the Map View. Cell Configuration Editor/Sector Searcher by Filter. Open the Cell Configuration Editor dialog. Filter Expression Builder. Open the dialog to build a search criteria. Save. Save the selected scenario version. Save As. Save the selected scenario version as a new scenario version. Rename. Rename the selected scenario version. Remove. Remove the selected scenario version. Pack Version for Sharing. Pack the selected scenario to a ZIP file. This ZIP file can be shared with peers and unpacked to other projects. Export Version to TEMS Investigation XML Cell File. Export the selected scenario version to a TEMS Investigation XML cell file. Export Version to Google Earth KMZ File. Export the selected scenario version to a KMZ file that can be displayed in Google Earth or any other tools that support KMZ files. Export may be generated with ‘Absolute altitude’ or ‘Clamp to ground’ height modes, and with standard (Point) or LineString geometries. All KMZ export is generated with metric/event legend information (supported in GE Pro version only) in all 4 corners of GE map view so one with appropriate placement can be enabled using GE data tree selection. |
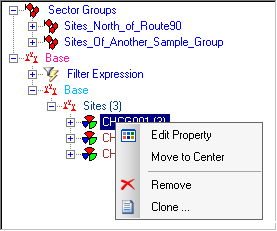 |
Edit Property. Open the Properties of Cell Site dialog. Move to Center. Move the selected cell site to the center of the Map View. Remove. Remove the selected cell site from the network configuration. Clone. Clone the selected cell site and bring up the Cell Site Properties for editing. |
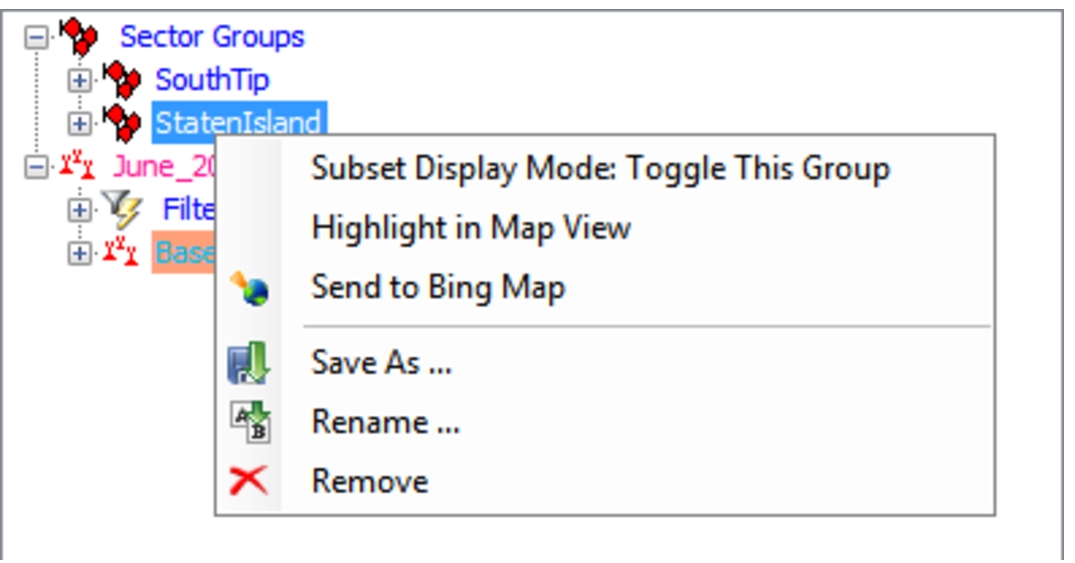 |
Subset Display Mode: Toggle This Group. In subset display mode, only the selected number of sector groups will be displayed in the Map View. Select this option to toggle the display of the selected sector group in the Map View. Highlight in Map View. Highlight the selected sector group in the Map View, if any of the network configurations are displayed in the Map View. Save As. Save the selected sector group as a new group. Rename. Rename the selected sector group. Remove. Remove the selected sector group. |
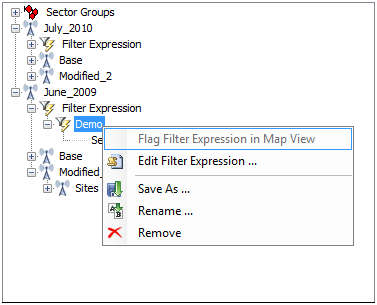 |
Flag Filter Expression in Map View. Apply the selected sector filter expression and highlight the sectors that meet the filter in the Map View, if any of the network configurations are displayed in the Map View. Edit Filter Expression. Open the dialog to edit the selected filter expression. Save As. Save the selected sector filter expression as a new filter expression. Rename. Rename the selected sector filter expression. Remove. Remove the selected sector filter expression. |
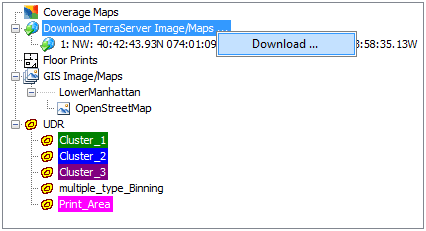 |
Download. Download an online GIS data source. See Download Online GIS Data Source. |
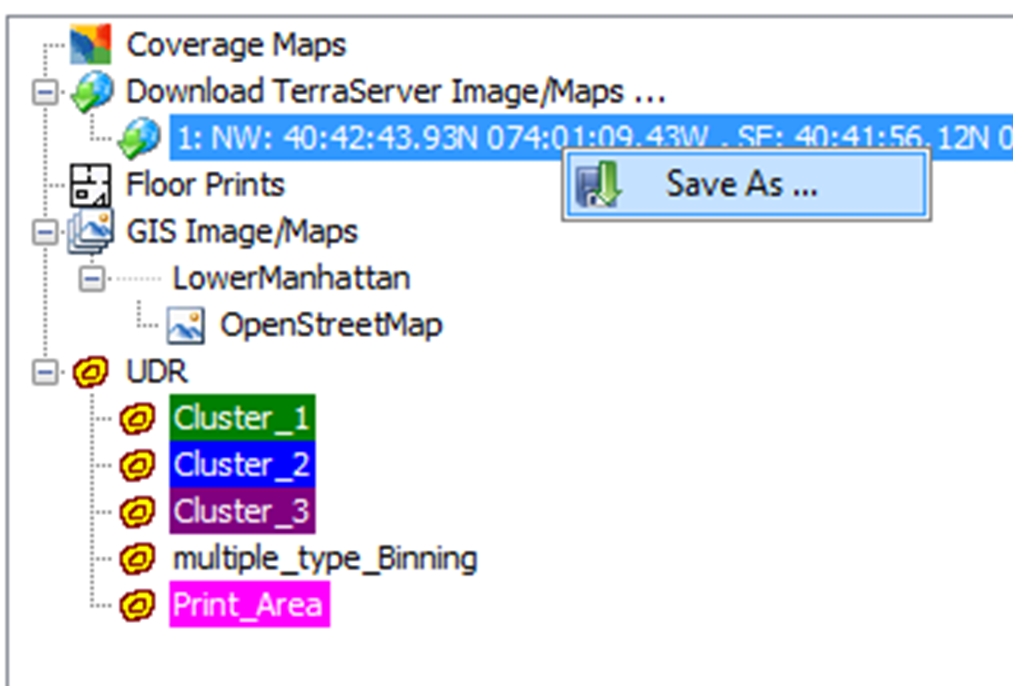 |
Save As. Once the online GIS data is downloaded, it can be saved as a map in the TEMS Discovery internal GIS format under the current project's geo area. That map will be listed under the Image/Maps category. |
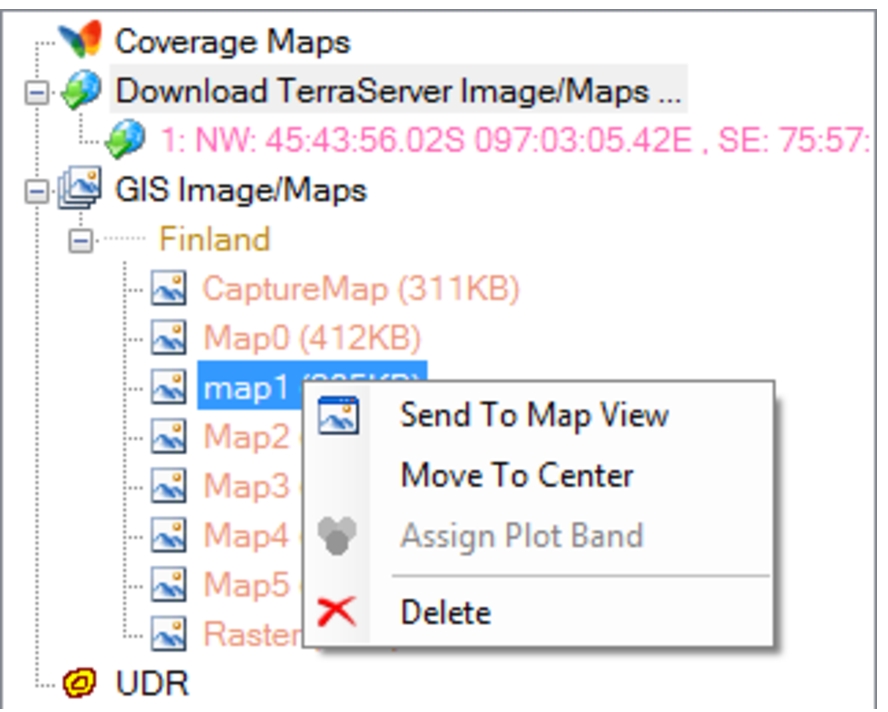 |
Send to Map View. Send the selected image/map to the Map View. Move to Center. Move the selected image/map, if displayed, to the center of the Map View. Delete. Delete the selected image/map. |
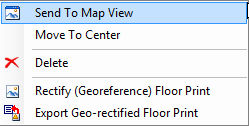 |
Send to Map View. Send the selected floor print to the Map View. Move to Center. Move the selected floor print, if displayed, to the center of the Map View. Delete. Delete the selected floor print. Rectify (Georeference) Floor Print. Bring up the Floor Print Rectifier to rectify the selected floor print. Export Geo-rectified Floor Print. Export the selected geo-rectified floor print to a user selected folder. A MapInfo TAB file containing the geo reference information in lat/lon geographic projection will be exported to the selected folder. |
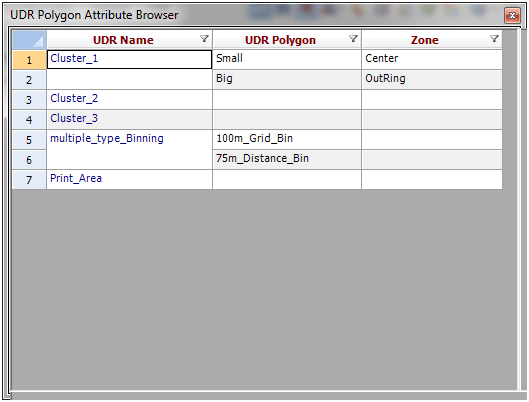
 |
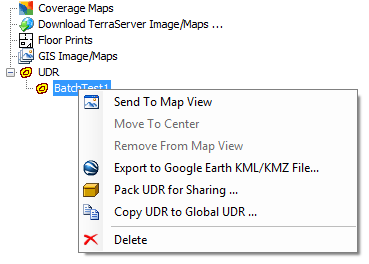 |
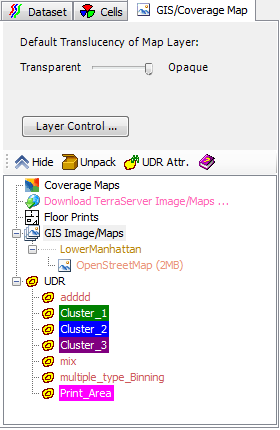
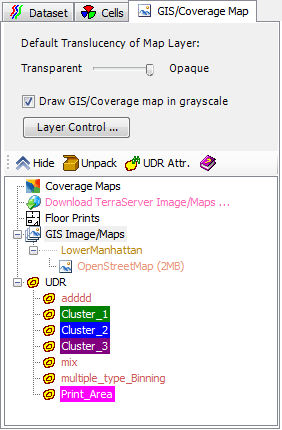
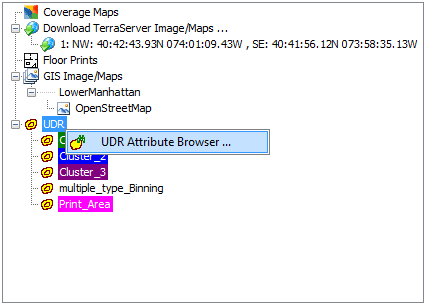
Send to Map View. Send the selected UDR to the Map View. Move to Center. Move the selected UDR, if displayed, to the center of the Map View. Remove From Map View. Remove the selected UDR from the Map View. **Export to Google Earth KMZ file… Export a KMZ file to import the area into Google Maps or other target. Pack UDR for Sharing. Save the selected UDR and its information as a .ZIP file. Copy UDR to Global UDR. Copy the UDR to the global UDR list. Delete. Delete the selected UDR. |
 in the Map View.
 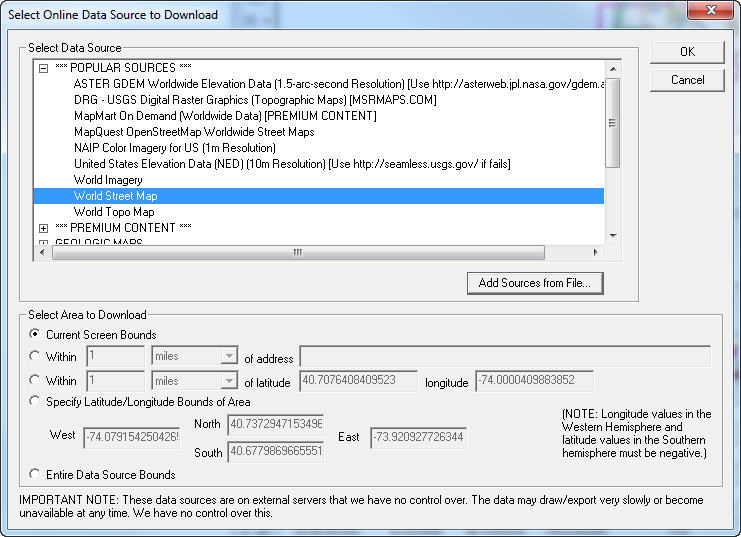 button on the Map View toolbar, the Save Map As dialog will appear prior to the Select Online Data Source for Download dialog.
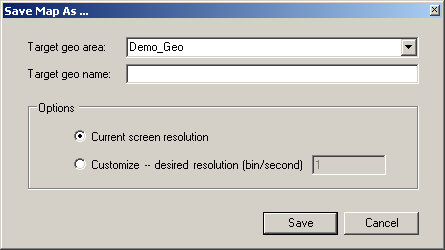
 on the GIS List toolbar.