 TEMS Discovery provides a set of default plot bands. However, you can modify, create, or choose a plot band definition for a metric. TEMS Discovery provides a set of default plot bands. However, you can modify, create, or choose a plot band definition for a metric. in the toolbar on the Main Window.
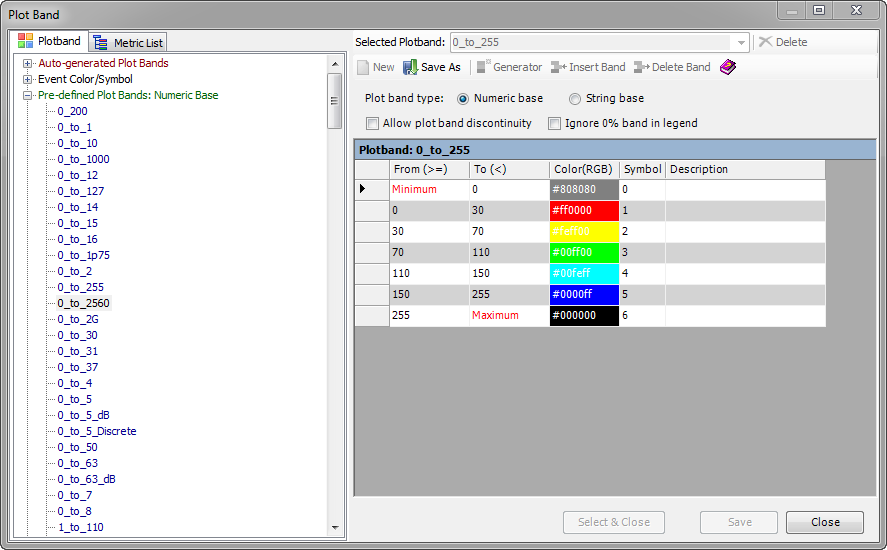
 | Delete. Delete the selected plot band definition. |
 | New. Create a new plot band. |
 | Save As. Save the currently displayed plot band as a new plot band. |
 | Generator. Generate a new plot band definition from scratch. This option will bring up the Plot Band Auto Generator. |
 | Insert Band. Insert a band to the spreadsheet. |
 | Remove Band. Remove a band from the spreadsheet. |
 | Help. |
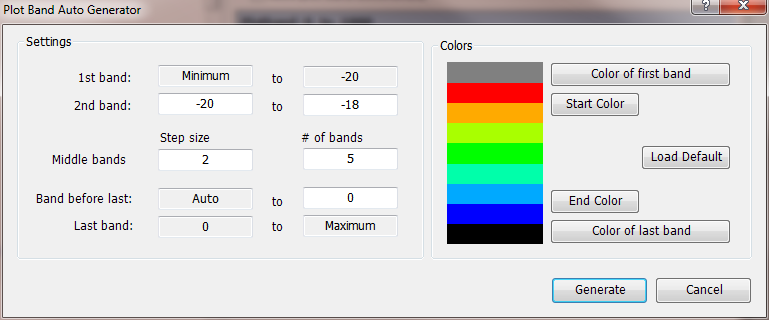
 Click Generate, and the plot bands will be generated automatically and the spreadsheet will be populated.
  To save the definition, click the Save button.