2.3 ADP Management

Automatic Data Processing (ADP) is an advanced configurable function that monitors newly arrived drive test data, automatically imports the data, generates reports, deposits the reports to a specified location, and/or sends the reports via email. ADP allows multiple computers to use distributed data processing. See
Data Networking Configuration for more information.
The ADP Management window can be accessed in the following ways:
• Selecting ADP Management from the Tools menu on the Main Window.
• Clicking the
Automatic Data Processing button
on the Main Window toolbar
. You can create a new ADP task by clicking the
New Task button

on the toolbar and following the wizard steps.
ADP tasks can be defined in the following ways:
• A purely file monitoring task that monitors file folders to import and processes the data files into TEMS Discovery.
• A purely output generating task that generates output (pdf and/or report) from project/datasets.
• A dual file monitoring and output task.
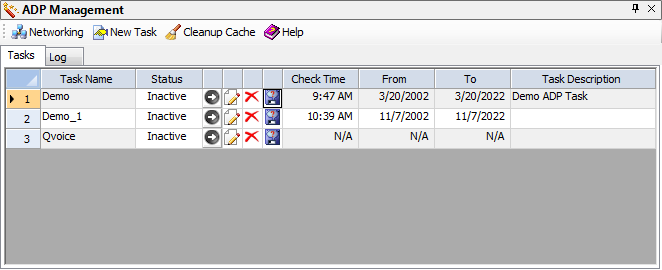
The Tasks tab on the ADP Management window lists the created ADP tasks in a table with the following columns and functions:
• Task Name. Shows the name of the task.
• Status. Shows the status of the task (e.g., Active or Inactive).
• Start/Stop button

. Starts or stops a task.
• Edit/View button

. Edits or views a task definition.
• Delete button

. Deletes an inactive task.
• Check Time. Shows the check time of the output generation.
• From and To. Shows the date range of the output data.
• Task Description. Shows a description of the task.
The Log tab shows the logging information for the ADP tasks.
To configure ADP to achieve distributed data processing, click the
Networking button

on the toolbar to access the
Data Networking dialog. To distribute the created tasks by this computer, this computer will serve as the Dispatcher and maintain a list of computers that are available to process data. See
Data Networking for more information.
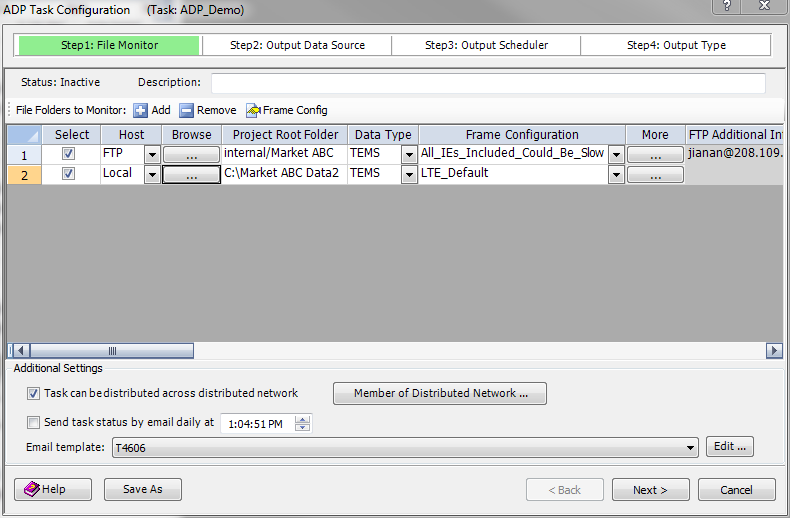
2.3.1 ADP Step1: File Monitor
The step 1 window of configuring an ADP task is shown below:
If you are creating a new ADP task for purely output purposes, you can skip this step by clicking the Next button.
The table lists all the file folders to be monitored by this ADP task.
• To add a new file folder to be monitored by this ADP task, click the
Add button

on the toolbar.
• To remove a file folder from the table, select the row to be removed and then click the
Remove button

on the toolbar.
The table has the following columns and functions:
• Select. Used to select or unselect a folder to be actively monitored by the task.
• Host. Indicates the folder to be monitored is Local to this computer or from an FTP server.
• Browse. Used to browse the Local folder or the FTP server folder and related information. More detailed information about the FTP server information is in the next section.
• Project Root Folder. Shows the folder name of the root folder of the project data.
• Data Type. Indicates what kind of drive test data file is to be monitored in this folder including drive test, PCAP, cell configuration, GIS, TD configuration and Image data types.
• Frame Configuration. Indicates which frame information is to be imported from the files in the folder being monitored. Click the
Frame Config button
on the toolbar to access the ADP Task Configuration dialog, where you can create or modify a Frame Configuration.
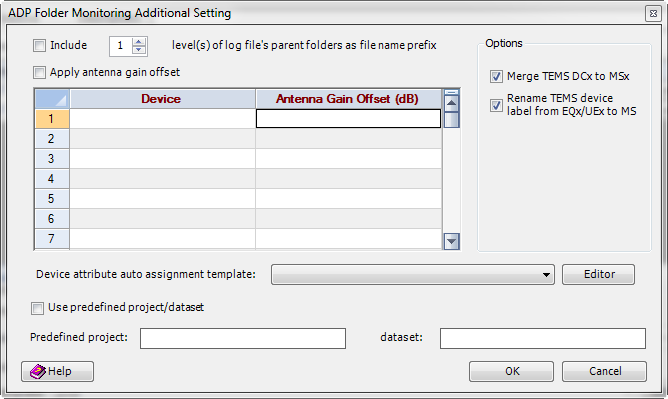
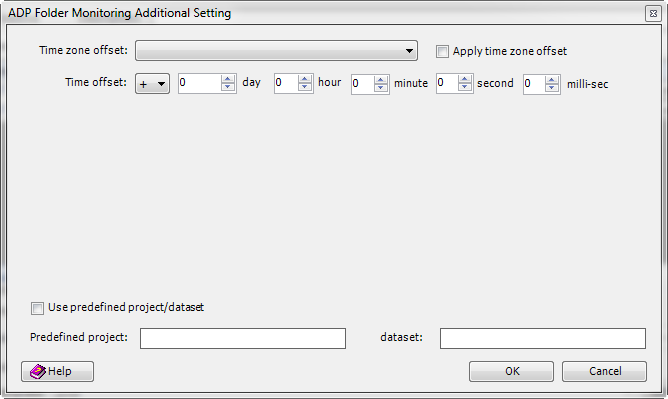
• More. Used to set up more data import options for the folder being monitored with option selection dependent on Data Type choice.
Drive test data type options include the rules for automatically assigning device attributes based on the device attribute assignment template (see
Device Attribute Assignment for more information), antenna gain offset, and smart file merge.
PCAP data type option include time zone offset correction.
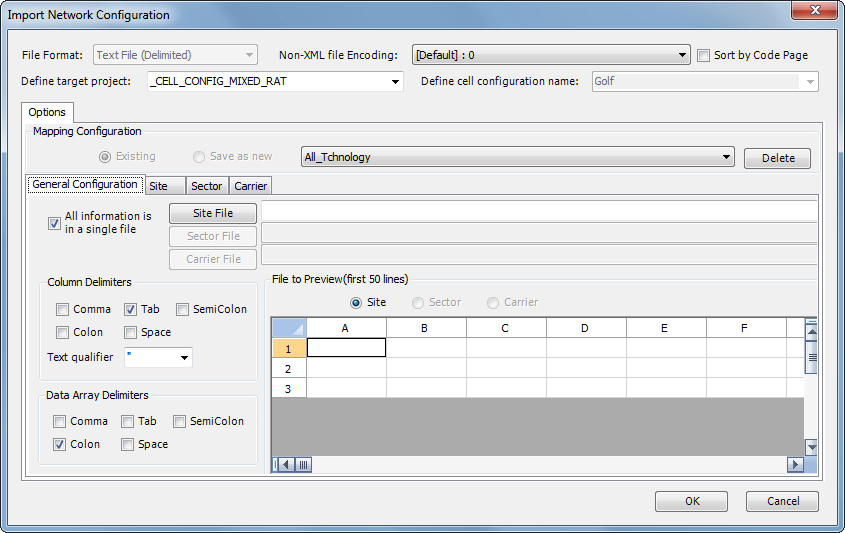
Cell configuration data type options allows user to define target project. In case when target project is not specified new project is automatically created using monitored ADP folder name. In case ‘NetworkConfig Text File (Delimited)’ data type is selected user will need to specify mapping configuration to be used in automatic import.
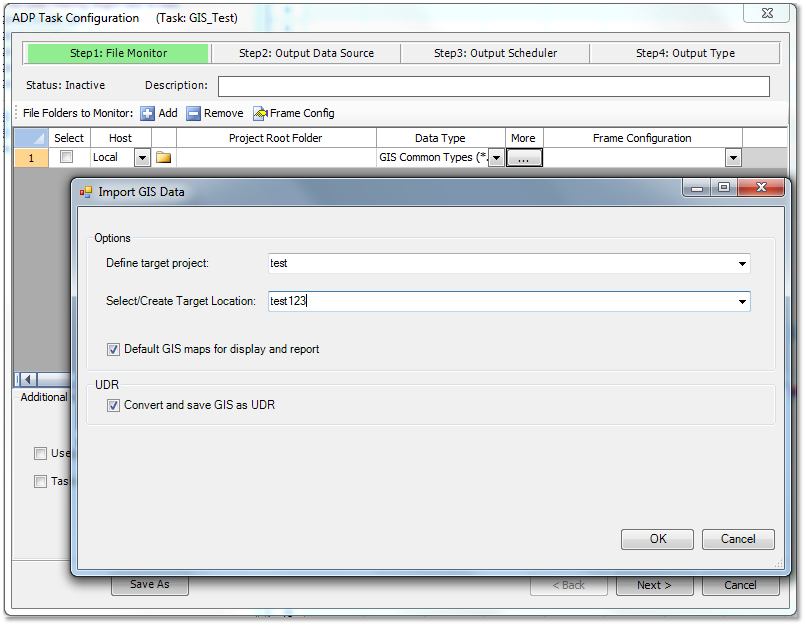
GIS options allows user to define target project and target geo area. In case when target project or target area are not specified new project and target area are automatically created using monitored ADP folder name. ‘Default GIS maps for display and report’ check box if selected would select respective option in
Project Properties - GIS Settings to automatically include imported GIS to Data Explorer and Report Builder Map View. Additionally, user may select ‘Convert and save GIS as UDR’ option for automatic conversion of closed area polygons to UDR. UDR cluster index used as reporting reference will be automatically generated for all UDRs created via ADP.
• FTP Additional Info. Used to display additional information for the FTP monitor folder.
Set up Monitored Folder (Project Root Folder) and Sub-folders
In order to monitor multiple projects and multiple datasets automatically, it is recommended that the monitored folder be set up according to the following structure:
<Monitored Folder>
<Sub folder 1 for Project 1>
<Sub-sub folder 1 for Dataset 1>
<Drive Test *.log files>
.....
<Sub-sub folder n for Dataset n>
...
<Sub folder n for Project n>
If no project sub-folders are under the monitored folder, TEMS Discovery will create the following default project and default datasets:
_ADP_Created_Project_From_Folder_<Monitored Folder>
_ADP_Created_DataSet
Also, TEMS Discovery will automatically create the following two sub-folders after execution of an ADP task:
• Imported. Log files that are successfully processed will be moved to this folder.
• FailedToImported. Log files that are not successfully processed will be moved to this folder.
You should never manually place any log files to be processed under the Imported or the FailedToImported folders.
Additional Settings
Task can be distributed across distributed network. If you would like to utilize processing resources from other computers on the same network to help process new monitored data files when this computer is busy, turn this option on.
Member of Distributed Network. If you want to add or modify the distributed network information, click this button to access the necessary dialog.
Auto assignment of Cell Configuration Index. Cell configuration index is used as selection reference in Map View reporting element. Auto assignment of CCI was made to be independent from order of cell configuration import. CCIs are dynamically updated by alphanumerical order whenever new configuration is loaded, regardless if ADP or manual import method was used. Appropriate cell configuration names must be used to ensure preferred indexing, e.g. 1_NR.., 2_LTE.., 3_WCDMA, etc.
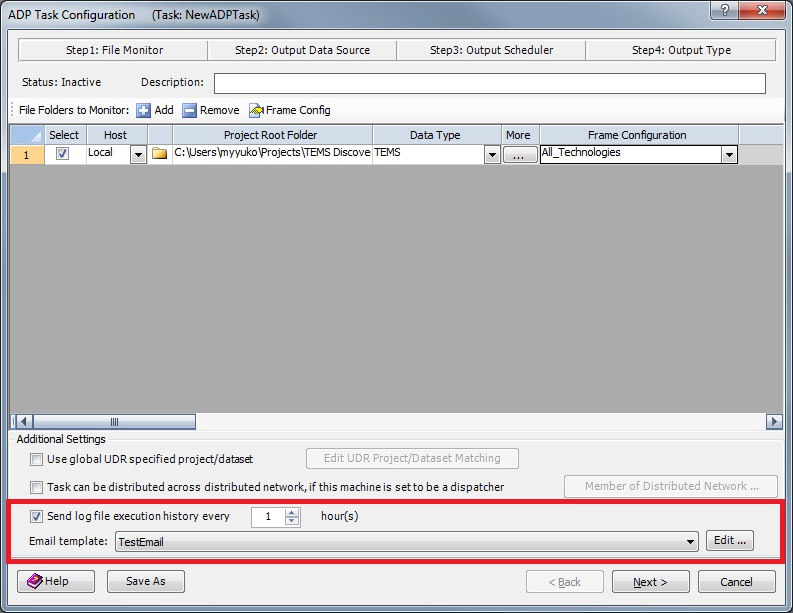
Send log file execution history every <x> hours. Automatically emails ADP task execution history with specified periodicity to selected email recipients.
Enable File Checks. If enabled, Enterprise ADP option will run additional log file integrity checks and prevent processing of corrupt or incomplete log files.
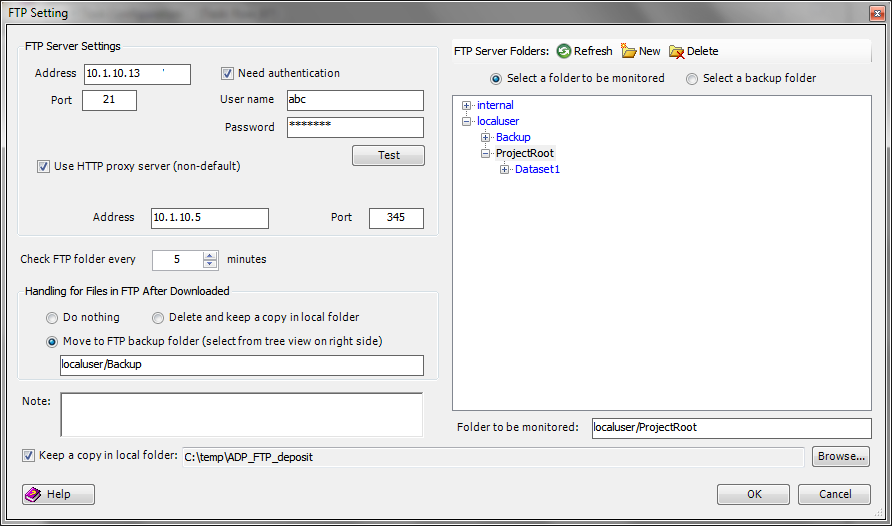
FTP Setting. If you have selected FTP as the Host type, clicking the button in the Browse column will bring you to the FTP Setting window.
FTP Setting Window parameters:
• Address. IP address of the FTP server to be monitored.
• Port. Port number of the FTP server to be connected to. If you don't know this value, contact the FTP server administrator.
• Use HTTP proxy server (non-default). If you do not explicitly define the proxy server setting, the default proxy setting in your Windows Internet options will be applied when connecting to FTP.
• Need authentication. If the FTP folder to be monitored can be accessed anonymously, do not check this option, and TEMS Discovery will try to connect to the FTP server as an anonymous user. Otherwise, check this option and provide the user name and password to be used by TEMS Discovery when connecting.
• Check FTP folder every x minutes. TEMS Discovery does not monitor the FTP folder constantly; it checks for new files periodically. The default interval for checking files is 5 minutes. If a shorter interval is selected, the CPU usage and network traffic will increase, and vice versa.
• Handling for Files in FTP after Download. After downloading the data files from FTP, you can elect to keep a copy in the local folder and then remove them from the FTP server, or you can relocate the files to another FTP folder as a backup. It is OK to leave them in the monitored FTP folder without further action, but this option is not recommended.
• Keep a copy in local folder. Specify a local folder where TEMS Discovery can download the new data file from the FTP server and keep it as a copy.
• Project root folder. As when monitoring a local folder, you need to specify the Project root folder to be monitored on the FTP server. This folder must follow the same rules as for the locally monitored folder.
• Note: You can put any text notes here for your own reference purpose.
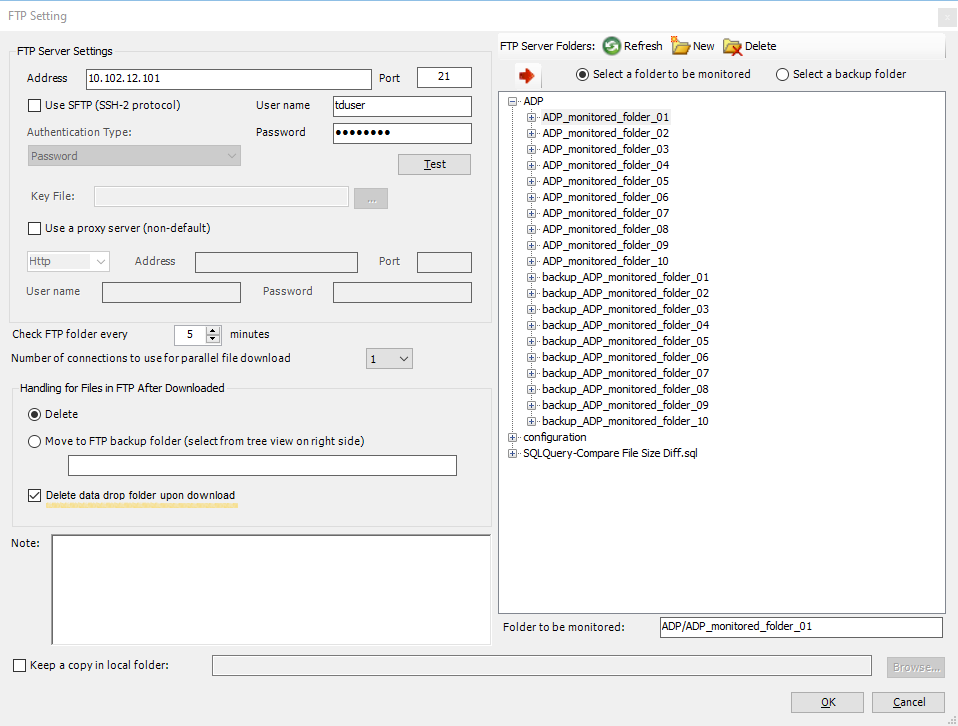
Select the Select a folder to be monitored or the Select a backup folder radio button before selecting a folder to be monitored or selecting a backup folder from the folder browser by highlighting the folder.
When you click OK, TEMS Discovery will try to connect to the FTP server with the information you provided and check whether at least one set of project/dataset folders is available under the Project root folder being monitored.
FTP data drop folders may be automatically deleted in TEMS Discovery Enterprise setup by enabling ‘Delete data drop folder upon download’. Data drop folders will be automatically deleted once all log files are downloaded, unless data is dropped directly to FTP monitored (root) folder.
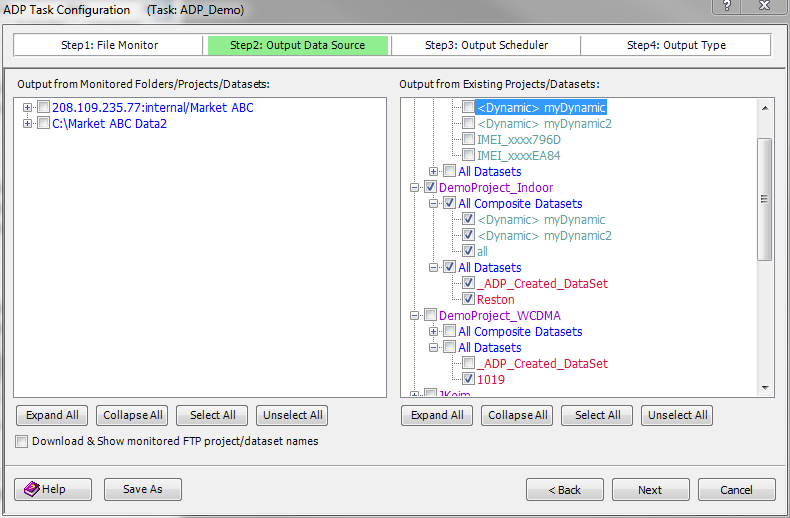
2.3.2 ADP Step2: Output Data Source
The step 2 window of configuring an ADP task is shown below:
This window has two tree views showing projects and datasets that can be selected as the output data source.
The left side tree view shows the current project and dataset folders under the monitored Project Root Folder of this task. The right side tree view shows the output from the existing projects/datasets. When you select/unselect a tree node on one tree, TEMS Discovery will automatically select or unselect the corresponding node on the other tree if there is one on the other tree.
Download & Show monitored FTP project/dataset names. If you have an FTP folder to be monitored by this task, enable this checkbox (it is unchecked by default). If your computer is connected to the network and you want to make a specific tree node selection, checking this option will direct TEMS Discovery to connect to the FTP server and download the current project and dataset subfolder names from the monitored FTP folder. (If the network or the FTP server is slow and/or the folder has many subfolders, it could take a while for Discovery to download all the information.)
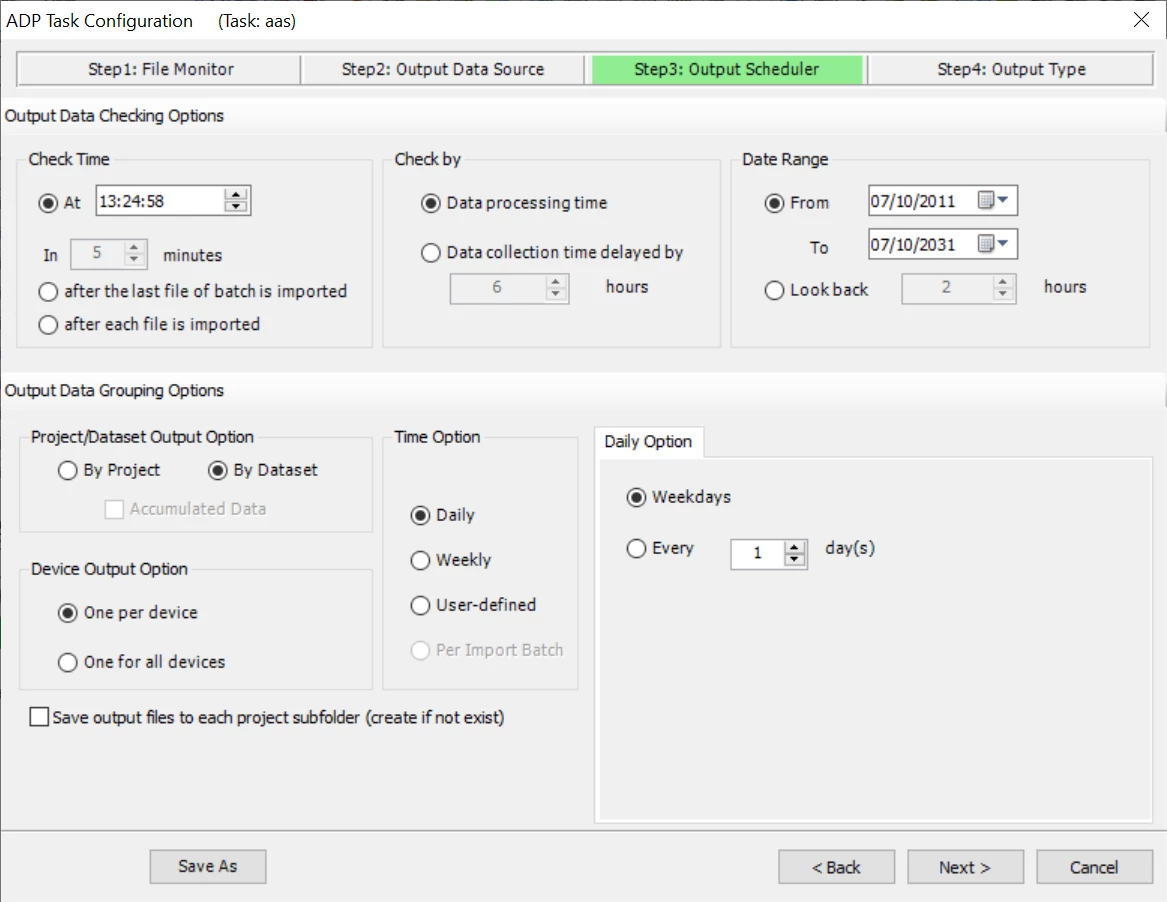
2.3.3 ADP Step3: Output Scheduler
The step 3 window of configuring an ADP task is shown below:
Output Data Checking Options
Check Time. These settings tell TEMS Discovery when to check the project/dataset for the defined time interval to generate the output by using one of the following options:
o ‘At’ sub-option to trigger output at a certain time of day
o ‘In <number> minutes after the last file of batch is imported’ sub-option to trigger output in specified number of minutes after the last measurement data file of a batch is imported. Note that in case when the time gap between dropping the log files to the ADP monitored folder is longer than batch wait time, log files received at a later time will be placed in a separate batch for which separate output will be generated.
o ‘In <number> minutes after each file is imported’ sub-option to trigger output in specified number of minutes after importing each measurement data file.
Check by. These settings tell TEMS Discovery how to check the data, by Data processing time or by Data collection time.
At the check time, the active ADP task will check the project/dataset selected at
Step 2 up to the beginning of the start time interval and generate the output as defined by the task.
If the Check by option is set to Data collection time, the delayed by hours value will be added. For example, if the delayed by hours value is 6, then the time range of a day's data will be 6 AM to 6 AM on the following day.
Date Range. These settings tell TEMS Discovery what date range should be considered when generating the output. For example, if you have data in the project/dataset as old as January 1, 2010, but you only want to generate output from March 1, 2010, you can set the starting date as March 1, 2010. Note that you can define a more flexible date range by defining the number of hours to look back from the check time.
Once an ADP task with an output option set is activated and TEMS Discovery keeps running on the computer, TEMS Discovery will try to generate the output based on the settings every day at the Check time. TEMS Discovery will keep track of which days’ data have been processed for output. If you stop and restart a task that has generated some output for some days, TEMS Discovery will ask whether you want to re-generate the output from the Start date.
Output Data Grouping Options
Time options:
• Daily. The output will be generated daily, and every day's data will appear in one output file (if set to Weekdays, output will only be generated Monday through Friday).
• Weekly. The output will be generated at weekly intervals (every week or every few weeks) according to the definition of the week's start day.
• User-defined. The output will be generated according to the date range defined by the user.
• Per Import Batch. The output will be generated according to the data which has been imported in the latest batch.
Device Output options:
• One per device. The output will be generated as one per device.
• One for all devices. The output will be generated as one for all the devices.
Project/Dataset Output options:
• Project. The output data will be grouped by project.
• Dataset. The output data will be grouped by dataset.
• Accumulated Data. Grouping option allows users to generate output for the entire (accumulated) project or dataset selection when triggered by closure of the most recent batch. The option may be used for automated benchmarking of multiple drive test iterations. The use case requires that drive test iterations (batches) are separated by device attribute filters created automatically by use of distinct drive test iteration file naming.
Save output files to each project subfolder (create if not exist)
Normally TD will output all files to used-defined output folder. The project name will be concatenated in the output file name. If you like to group output files by each project, you shall check this option. A subfolder will be created for each project and the output files will be saved in each subfolder respectively.
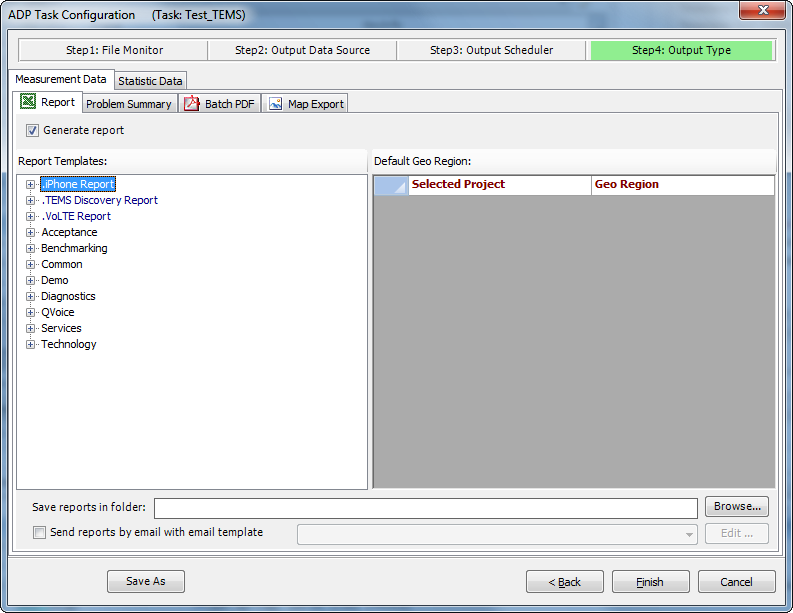
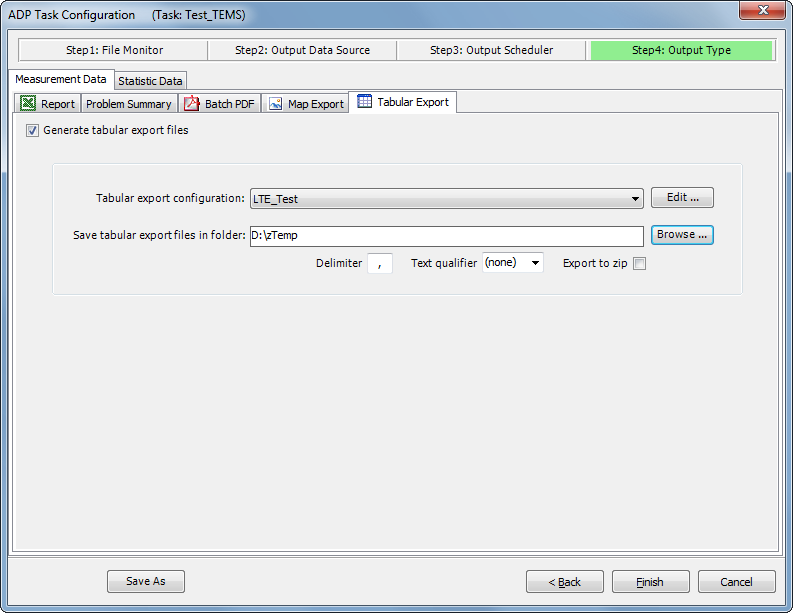
2.3.4 ADP Step4: Output Type
The step 4 window of configuring an ADP task is shown below:
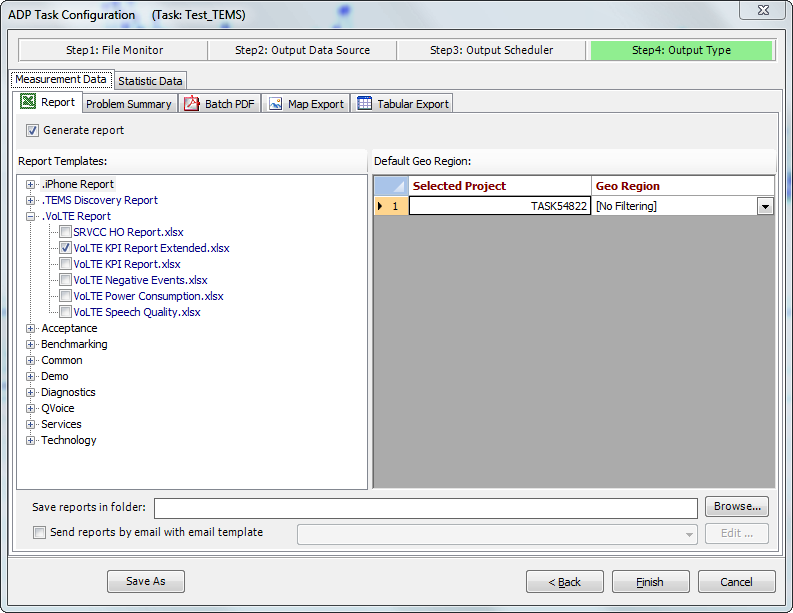
User may select up to four different type of output for Measurement Data (Report, Problem Summary, Batch PDF, Map Export and Tabular Export) and one for Statistic Data (Report). For measurement data Report or Problem Summary output user should select one or more report templates and specify output folder.
For measurement data Batch PDF, Map Export or Tabular Export output user should select one of previously defined Batch PDF, Map Export or Tabular Export configurations respectively (see further under
Batch Configuration,
Tabular Export Configuration and
Map Export Configuration) and specify output folder. User may edit selected configuration directly from ADP Task Configuration window for any last-minute changes.
Measurement Data Report, Batch PDF and Map Export output may also be automatically emailed to users specified in
Email Template sub-option.
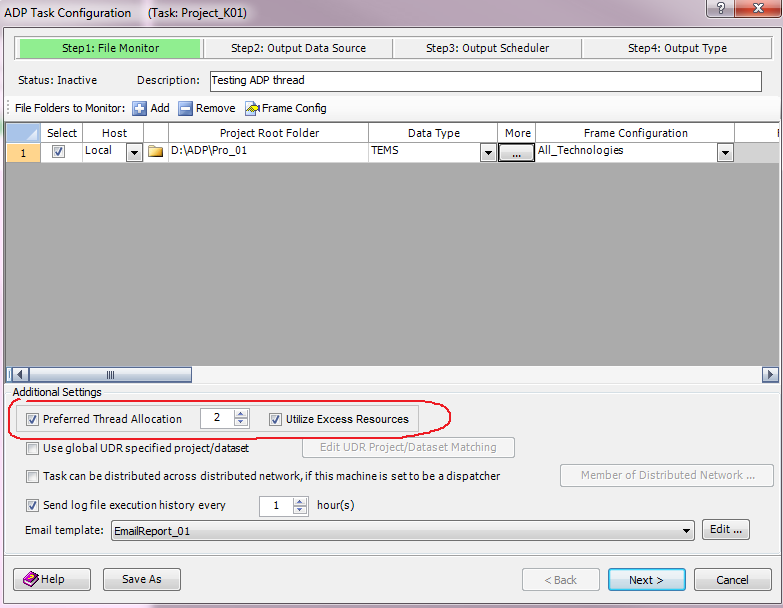
2.3.5 ADP Task Prioritization
‘Preferred Thread Allocation’ option of ADP Task Configuration allows users to specify preferred number of processing threads per ADP task. Number of allocated threads determines relative task priority. Additionally, preferred thread allocation will prevent processing delays in scenario when tasks started early consume all available resources until all of their log files are processed. Preferred thread allocation is applicable to all data types (drive test log files, cell configuration files, GIS files, TD configuration files). Any unused processing resources after completion of file import are always returned to the common pool of resources, i.e. thread assignment per task is never permanent.
'Utilize Excess Resources’ sub-option determines if ADP task will use any additional processing resources, if available. Excess resources are allocated on first come, first served basis. In case when 'Utilize Excess Resources’ check box is unselected, preferred thread allocation will be used as hard floor in terms of processing threads which may be useful to prevent ADP tasks with large of number small log files syphons all idle processing resources and facilitate more even and predictable report generation time independent from system utilization.
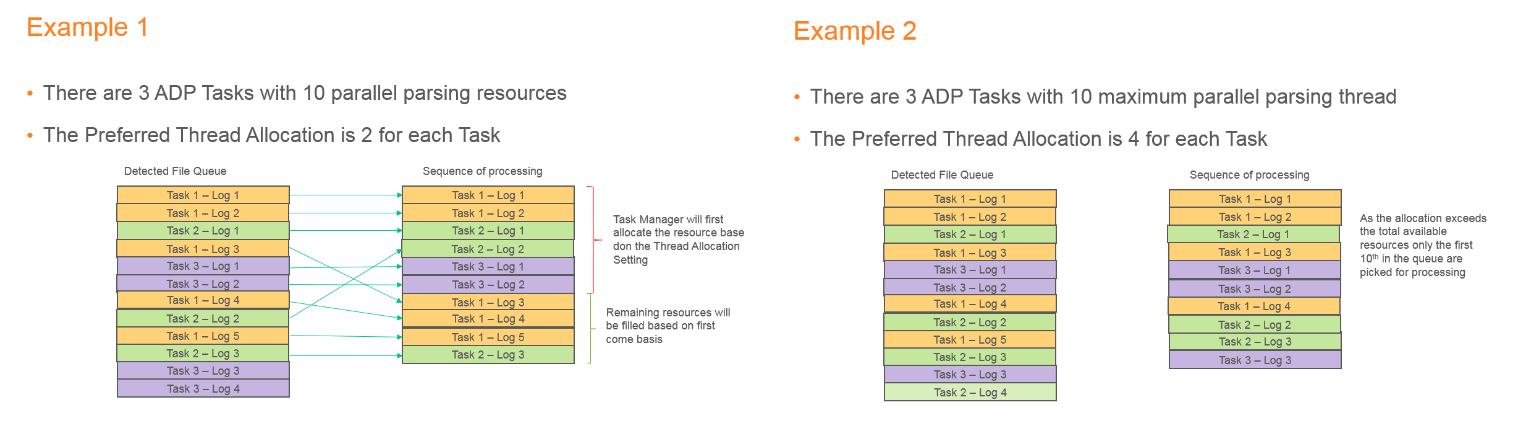
Example 1 depicts scenario in which total of 10 processing threads is shared by 3 active ADP tasks defined with ‘Preferred Thread Allocation’ set to 2, so assuming all 3 detected file queues are populated, each task will get allocated 2 processing threads with remaining 4 threads distributed on first come, first served basis. In example 2, total number of threads specified by preferred allocation (12 = 3x4), is greater than total number of available threads, in which case threads will be allocated on best effort basis, i.e. one task will get requested 4, while other two will get 3 processing threads.
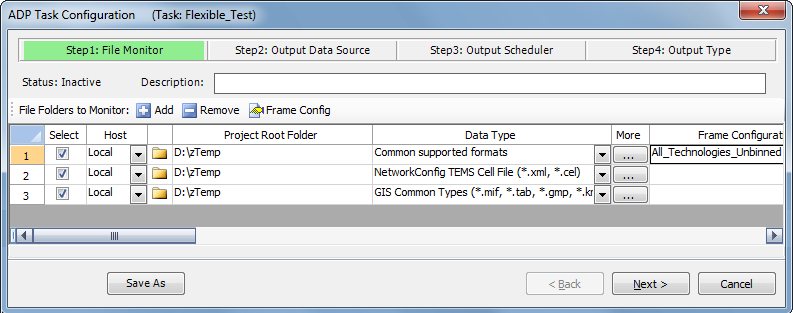
2.3.6 Flexible ADP Content Scanning
Original ADP implementation allowed for monitoring of only one type of information per monitored folder and ADP task. Flexibility of data content scanning was increased since then so that automatic import of all data types under a single monitored folder is allowed by defining one sub-task for each distinct data type.
Selection of different data types sharing same file extension is prevented in single monitored folder setup, e.g. .txt and .zip extensions are in this case reserved for network configuration and drive test data type import respectively. Recommendation is to use 'Common supported formats’ Data Type selection for drive test data in multi sub-task setup as it covers all major formats including .zip archives.
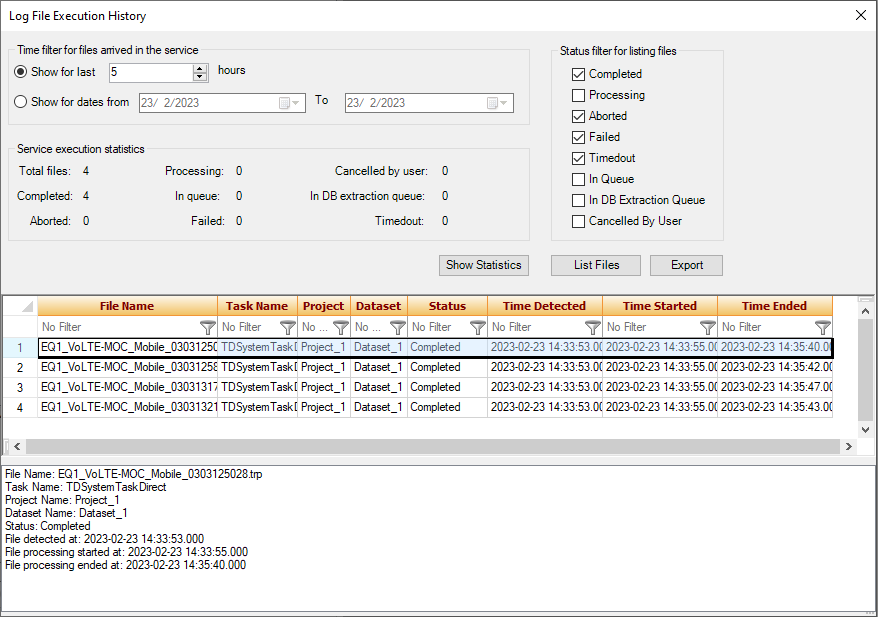
2.3.7 ADP Log File Execution History
'Log File Execution History’ is an Enterprise feature providing near real-time ADP service execution statistics. Service execution statistics are generated by selecting ‘Show Statistics’ button for the time period selected using ‘Show for last X hours’ or ‘Show for dates from X to Y’ radio button options including all file types and ADP generated reports. Detailed (per file) statistics are generated for processing states selected under ‘Status filter for listing files’ check box range by selecting ‘List Files’ button.
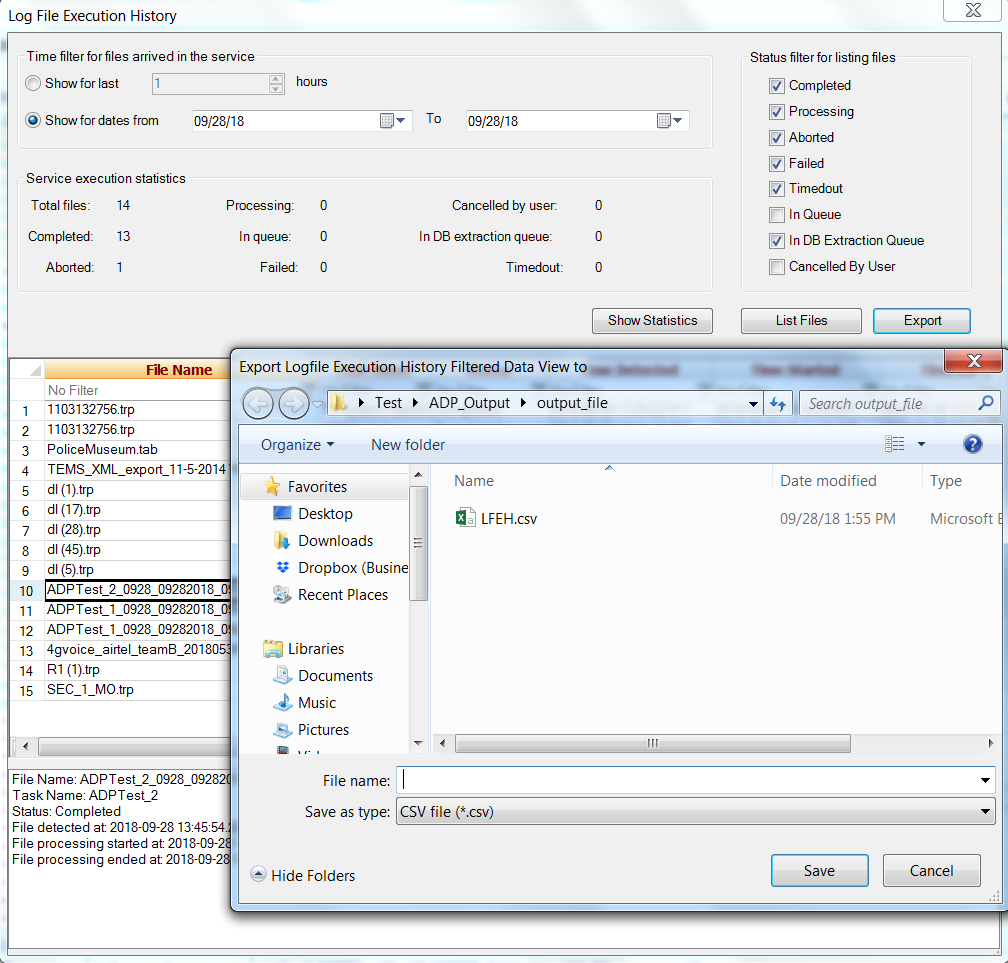
Detailed file list may be filtered per column supporting filtering per file name/extension (e.g. .xls or .xlsx for ADP generated reports) and ADP task name. ADP service execution statistics and per file details may be exported for selected time period in .csv format by selecting Export button.
Per ADP task service execution statistics including list of log files that failed processing may be additionally delivered by email every 1-24 hours to users subscribed via ‘Send log file execution history every X hour(s)‘ option under ‘ADP Task Configuration’.