4.26 Specific Topics
4.26.1 Floor Print Rectifier
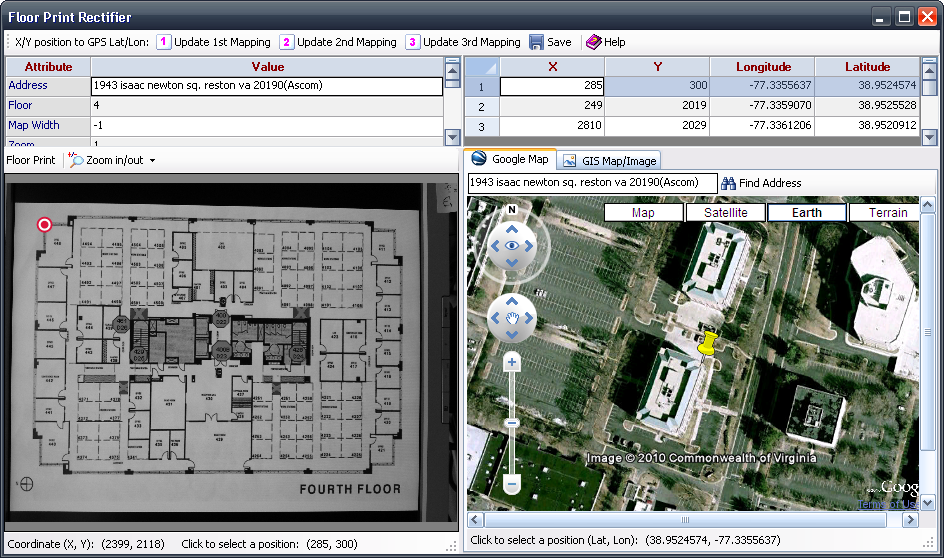
For indoor type projects, you can use the Floor Print Rectifier tool to rectify the floor print so it can be used with outdoor maps.
To rectify a floor print, perform the following steps:
1. Open the indoor project you want to rectify.
2. Go to the GIS/Coverage Map tab.
3. Right-click the floor print you want to rectify – it should be listed under the Floor Prints tree node.
4. Select Rectify (Georeference) Floor Print from the context menu.
5. Click a corner point on the floor print as the 1st mapping point.
6. Find the corresponding point on the GIS Map (GoogleMap or BingMap, depending on your TEMS Discovery license) display on the right-side window.
7. Click the Update 1st Mapping button in the toolbar.
8. Repeat steps 6 and 7 for the next two corner points for the 2nd and 3rd mapping.
9. Save the result and close the window.
4.26.2 Save & Restore Working Environment
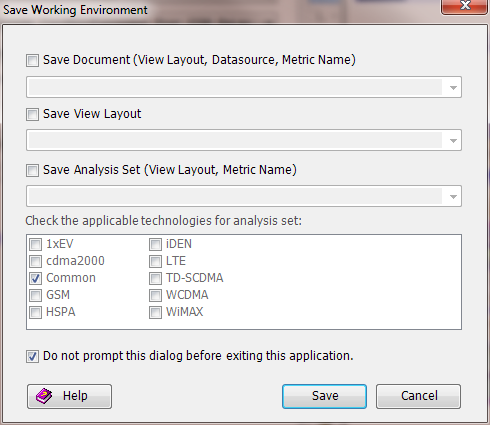
TEMS Discovery can easily restore the working environment. The Save Working Environment dialog can be accessed in the following ways:
• Clicking the
Save button

on the toolbar.
• Selecting Save from the File menu on the Main Window.
• Save TEMS Discovery Document. Multiple projects and display data can be opened and shown in multiple views, then saved as a TEMS Discovery document. All data, including the view layout, will be saved. To open a TEMS Discovery document, select from the list in
Document List • Save View Layout. The current view layout can be saved and restored for any project by right-clicking the target project in the
Project List and
selecting Open View Layout from the context menu. • Save Analysis Set. Save the current view layout, along with the type of data currently displayed as an Analysis Set. This analysis set can then be applied to any mobile data by right-clicking a target mobile in the
Project List or
Data Explorer–Dataset and selecting
Open Analysis Set from the context menu. It can also be selected when opening a project/device in the
Walk-U-Through wizard.
4.26.3 Cell Configuration
TEMS Discovery can import network configurations in a text delimited file format (see
Import Network Configuration for more information). The imported configuration can then be displayed graphically in the
Map View, and the information can be manipulated in various ways (see
Data Explorer–Cells and
Map View for more information).
Note: Since TEMS Discovery is not intended for network planning purposes, its editing capacity is limited. TEMS Discovery does not provide the functions to add or remove new cell sites or sectors, but does allow a user to modify parameter values or to add/remove parameters (see
Edit Cell Configuration and
Edit Cell/Sector Parameters for more information).
4.26.3.1 Edit Cell Configuration
Cell configurations can be imported with the
Import Network Configuration feature via a customized text delimited file. The cell configuration can be displayed in the
Map View for various operations. Once the cell configuration is imported, it can be manipulated directly in the Map View, or from the Cell Configuration Editor.
The Cell Configuration Editor can be accessed from the
Data Explorer–Cells right-click menu.
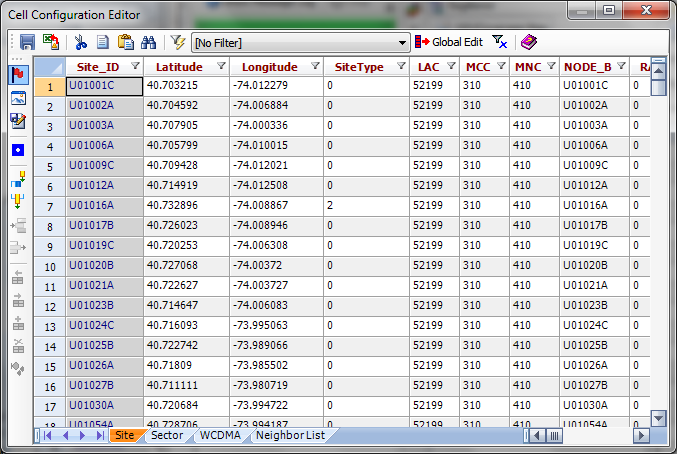
The Cell Configuration Editor contains four spreadsheets of information for cell sites, sectors, technology, and the neighbor list. You cannot add or delete cell sites or sectors, but you can modify the values of the parameters and add new parameters. In the Neighbor List spreadsheet, you can add a new neighbor list to a sector and modify the neighbor list. All changes can be permanently saved.
A dropdown menu in the toolbar lists the sector filter expressions that have previously been created. Select any of the filters to apply it to the cell configuration, and the filtered sectors will be listed in the spreadsheet. Click the
Filter Expression Builder button  to
to bring up the
Sector Filter Expression Builder, where filter expressions can be edited.
In each column header, you can click the small filter button

and select a string to filter the data in that column. Press the
Reset Row Filter button

to reset the filters.
Cell Configuration Editor Toolbar
| Save Network Configuration. Save any changes to the cell configuration. |
| Save As Excel File. Save the cell configuration to an Excel file. |
| Delete the Selection. Cut the text in the selected cell. |
| Copy the Selection to Clipboard. Copy the text in the selected cell to the Clipboard. |
| Paste to the Specified Cell. Paste the text into the selected cell. |
| Search Text. Bring up the Search dialog to search text in the spreadsheet. |
| Filter Expression Builder. Open the Sector Filter Expression Builder. |
| Global Edit. Global edit a parameter. |
| Reset Row Filter. |
| Help. |
| Highlight in Map View. Put a red flag in the site that is selected in the spreadsheet. |
| Highlight the Site/Sectors Listed in the Spreadsheet in Map View. |
| Save as Sector Group. Save the sectors listed in the spreadsheet as a sector group with name. |
| Unify Location of Sectors and Sites. |
| Add New Column. Add a new parameter to the spreadsheet. |
| Remove Selected Column. Remove the selected parameter from the spreadsheet. |
| Insert Rows. Insert the neighbor list to a sector. |
| Remove Selected Rows. Remove the neighbor list from a sector. |
| Shift the Selected Cells to Left. Move the selected neighbor to the left. |
| Shift the Selected Cells to Right. Move the selected neighbor to the right. |
| Insert a Cell. Insert a neighbor in front of the selected neighbor. |
| Remove the Selected Cells. Remove the selected neighbor from the list. |
| Filter Neighbor List. |
4.26.3.2 Cell Site/Sector Filter Expression Builder
The can create comparison expressions that can be used in sector searches.
You can access the in the following ways:
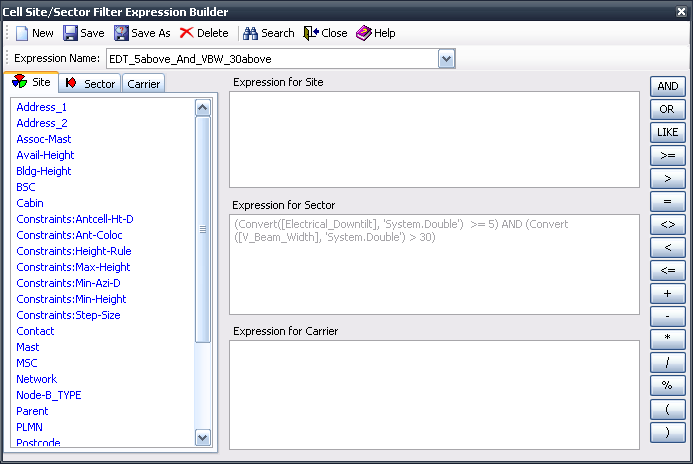
To search for a particular sector, create an expression containing the parameters of the Cell Site, Sector, or Carrier, in the respective “Expression for” window.
Drag-and-drop the parameter name from the list on the left side into the corresponding editor on the right side. The supported concatenation operators, logical operators, and arithmetic operators are listed on the far right. Click one of the buttons and the corresponding operator will be placed in the active editor.
The expressions can be saved with a name, after which the expression name will be listed in the
Data Explorer–Cells tab under the target scenario in cell configuration. You can use this expression to search for sectors and highlight them in the
Map View. The sectors can be saved into a sector group, which can then be used to filter drive test data.
Drag-and-Dropping Parameters
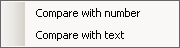
When dragging-and-dropping a parameter to the editor, a menu will pop up with two options, Compare with number and Compare with text.
If you choose to compare the parameter with a number, a string Convert(<parameter_name>, 'System.Double') will be dropped into the editor; otherwise, <parameter_name> will be dropped into the editor and the parameter will be compared with text.
Concatenation operators AND and OR
Concatenation is allowed for Boolean AND and OR operators. Use parentheses to group clauses and force precedence. The AND operator has precedence over other operators. For example:
(Antenna_Type = '731DG85V1EXM_850' OR Antenna_Type = '731DG85V1EXM_1900') AND Convert(Height, 'System.Double') >= 80
Matching operator LIKE
The LIKE operator is used in character string comparisons with pattern matching. Both the * and % can be used interchangeably for wildcard characters in a LIKE comparison. If the string in a LIKE clause contains a * or %, those characters should be escaped in brackets ([]). If a bracket is in the clause, the bracket characters should be escaped in brackets (for example [[] or []]). A wildcard is allowed at the start and end of a pattern, or at the end of a pattern, or at the start of a pattern. For example:
Antenna_Type LIKE '*DG85V1EXM_*'
Antenna_Type LIKE '*DG85V1EXM_850'
Antenna_Type LIKE '731DG85V1EXM_*'
Wildcard characters are not allowed in the middle of a string. For example, 'te*xt' is not allowed.
4.26.3.3 Edit Cell/Sector Parameters
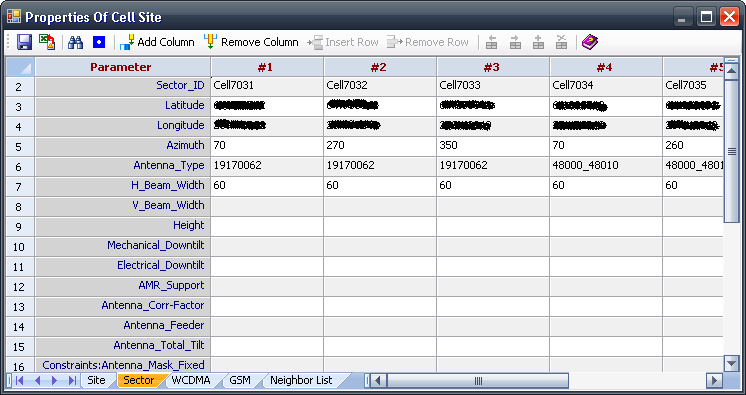
The Properties of Cell Site dialog, where the properties of a cell site or sector can be edited, can be accessed in the following ways:
• Click the
Cell Site Property button

in the
Map View toolbar, and then click the cell site or sector. Site selection list will pop-up in case multiple co-located sites are present.
This dialog contains multiple sheets containing information on the Site, Sector, Carrier and Neighbor List. You can modify the value of the parameters and save them permanently. You can also export the information to an Excel file.
Using the
Add Column 
or
Remove Column 
buttons on the toolbar, you can also add or remove a sector of the cell site, or add or remove a carrier of the cell site.
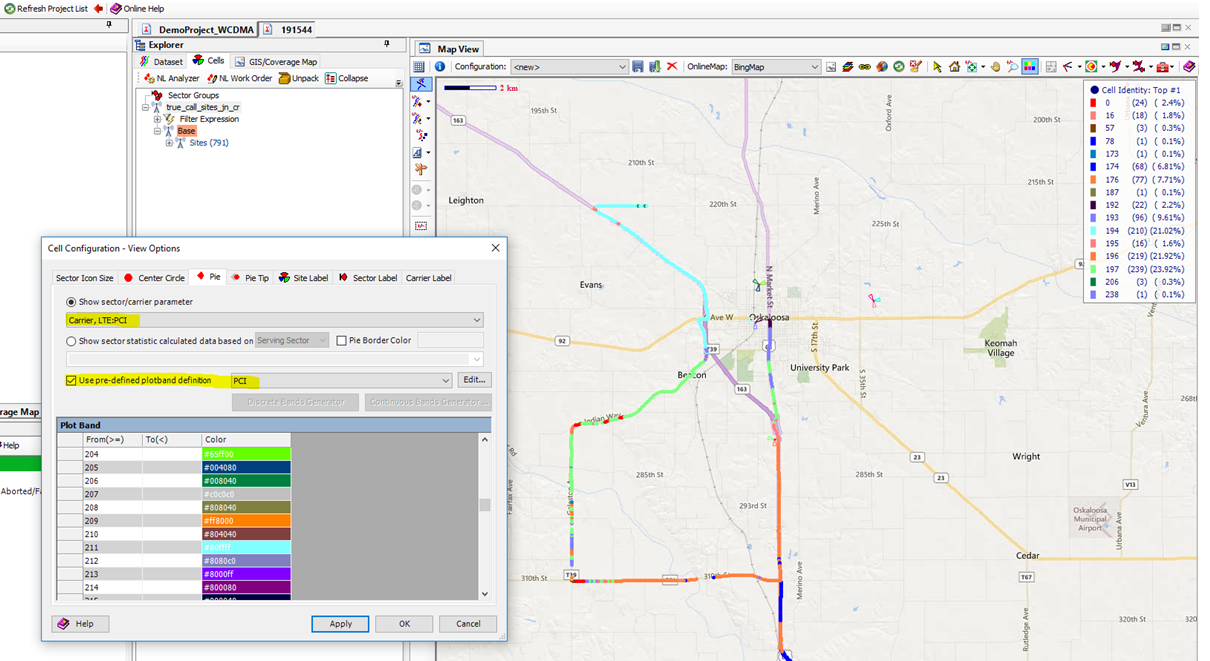
4.26.3.4 Cell Configuration View Options
Other than displaying the icon of the cell site and sector in the
Map View, the icon can be colored based on the value of a particular cell parameter or sector statistics data. Besides, the value of a cell parameter or sector statistics data can be printed on the screen as a label.
To edit the view options, right-click a scenario version in the
Data Explorer–Cells list and select
Edit View Options from the menu.
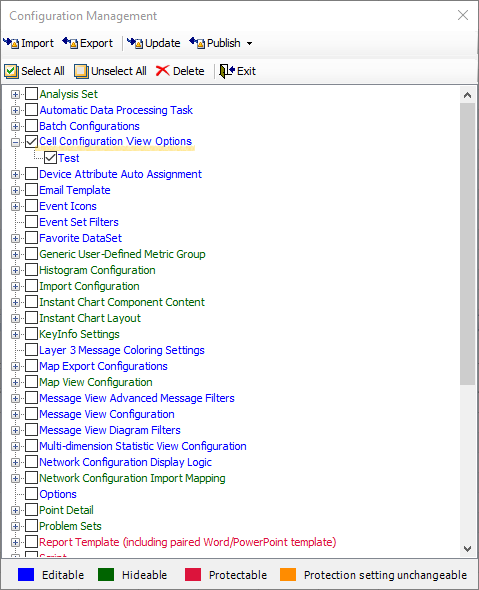
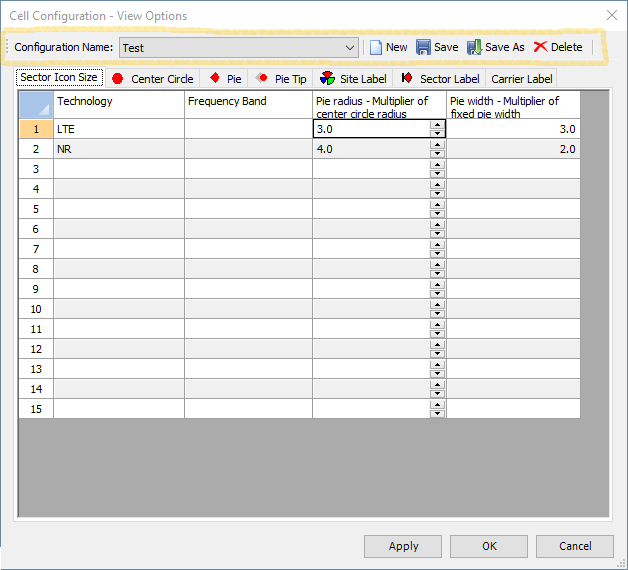
Cell Configuration View Options (CCVO) can be saved from the top level toolbar using Save or ‘Save As’ (under a new configuration name). Existing (previously saved) CCVO configuration template can be applied to current cell configuration by selecting it from the configuration drop down list, and can be removed with Delete. CCVO configurations can be exported or imported from
Configuration Management option.
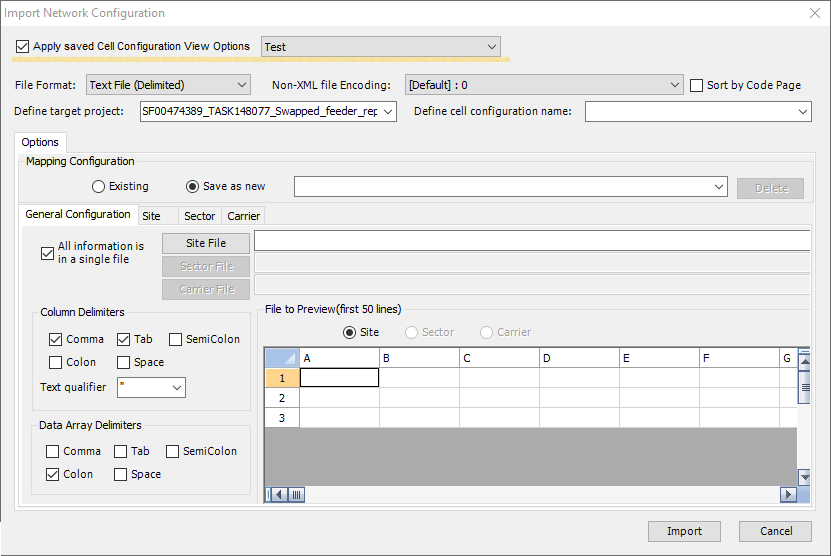
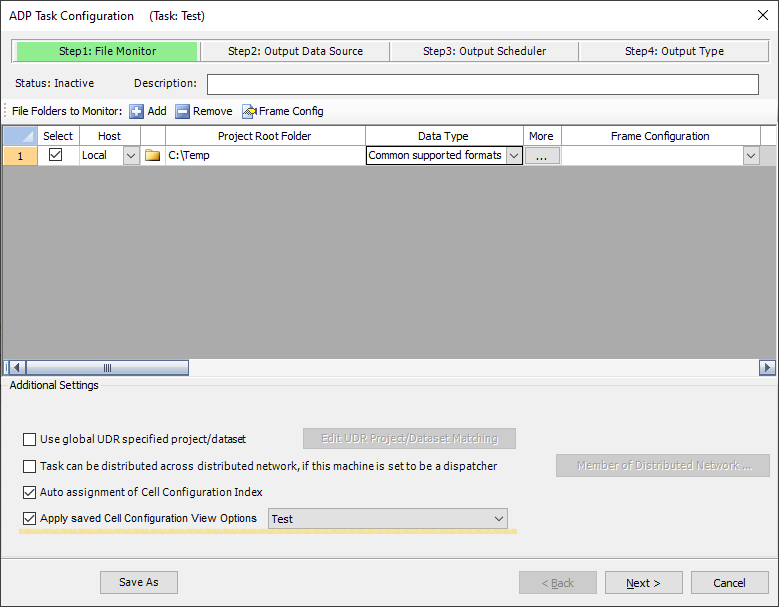
Saved CCVO configuration may be applied during manual or ADP cell configuration import, as well as to previously imported cell configurations:
• From manual cell configuration import UI, by selecting saved CCVO configuration from the drop-down list and confirming selection via Import button.
• From ADP task configuration UI, by selecting saved CCVO configuration from the drop-down list under ‘Step 1: File Monitor’ stage and confirming selection via Next button.
• From CCVO UI, for previously imported cell configuration, by selecting saved CCVO configuration from the drop-down list and confirming selection via Apply or OK buttons, or by closing CCVO UI.
The available view options are:
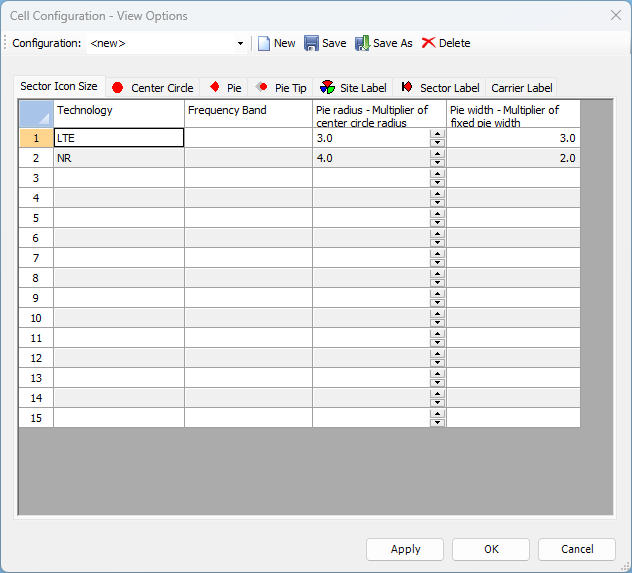
Sector Icon Size
Cell sector can be displayed as a fixed pie or pie with width per antenna beamwidth. To better distinguish different technologies/bands in each sector, a specific radius of the pie for the technology/band can be defined.
Saved CCVO configuration application limitations:
• Technology/Band values will always reflect actual cell configuration data and will not be changed by saved CCVO configuration application.
• Saved CCVO configuration ‘Pie radius’ and ‘Pie Width’ will only be applied to matching Technology/Band combinations.
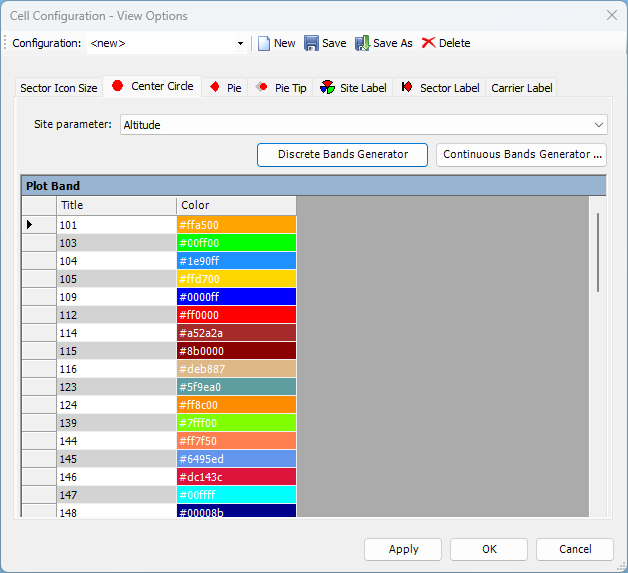
Central Circle
The center circle of the cell site icon can be colored by the plot bands defined for a particular cell site parameter. Select a cell site parameter from the dropdown menu; then click
Discrete Bands Generator to generate discrete plot bands or
Continuous Bands Generator to generate continuous plot bands. When displayed in the
Map View, the color of the center circle will be colored according to the plot band.
Saved CCVO configuration application limitations:
• Saved CCVO configuration ‘Center Circle’ tab settings will only be applied to current cell configuration if selected ‘Site parameter’ is available.
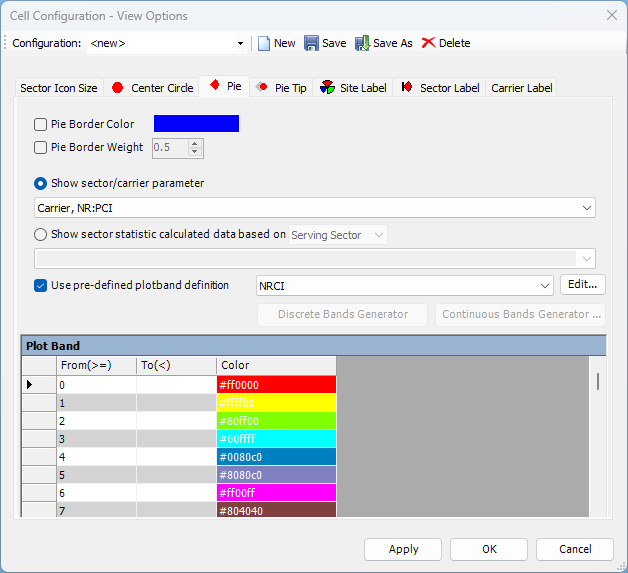
Color of Pie and Pie Tip
The color of pie can be used to indicate information from two categories:
• Sector/Carrier parameter
• Sector Statistics data
You can select any Sector or Carrier parameter and create the plot band following the same procedure as previously described for the
Center Circle; or you can select a specific data from the tree view in the dropdown menu to generate sector statistics data, and the plot band for showing sector statistics data will be auto-generated based on the plot band definition of this specific data (see
Data Explorer–Dataset for how to edit a plot band).
The
Cell Configuration Name and
Version fields define the cell configuration to which the statistic data will be generated. This cell configuration must be consistent with the default cell configuration of current project (see
Project Properties for more information).
‘Pie Border Color’ and ‘Pie Border Weight’ settings may be used for customization of sector border color and line weight in Map system view. Pie border user-defined settings will not be applicable if ‘Render solid pie’ or manual sector coloring ('Show sector/carrier parameter' or 'Show sector statistic calculated data based on..' options) are enabled. Pie border color and weight customization will be applied to non-serving/non-measured network layers only if standard ASC is enabled. Pie border color and weight customization will be applied to non-serving/non-measured sectors only if ‘Serving/Measured sectors only’ ASC sub-option is enabled.
Saved CCVO configuration application limitations:
• Saved CCVO configuration ‘Pie’ and ‘Pie Tip’ tab ‘Show sector/carrier parameter’ settings will only be applied to current cell configuration if selected sector/carrier parameter is available, with existing settings kept in place otherwise.
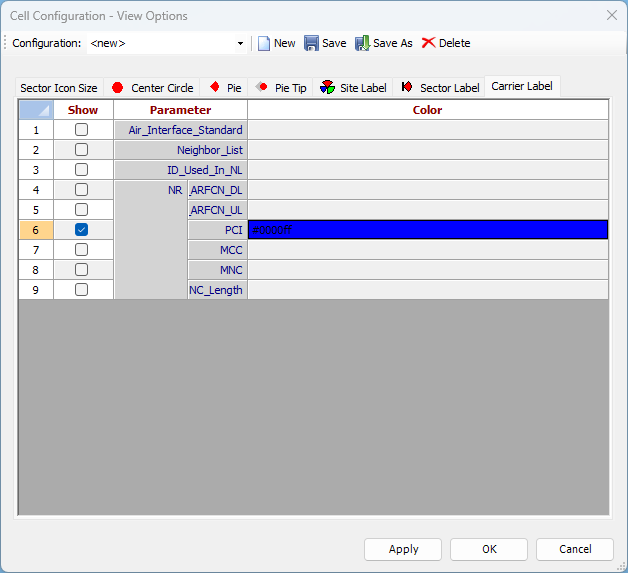
Labeling
The value of particular parameters can be printed as labels in the
Map View; you can also choose the colors of the labels. Additionally, specific data can be chosen from the tree view in the dropdown menu and print the sector statistics data as labels.
Saved CCVO configuration application limitations:
• Saved CCVO configuration ‘Site Label’, ‘Sector Label’ or ‘Carrier Label’ tab label state, color and position (if applicable) will only be applied to current cell configuration if selected parameter is available, with existing site label settings kept in place otherwise.
4.26.3.5 Overwrite Cell Configuration View Settings in Reporting
Selected cell configuration view settings (layering order, pie radius and width, labeling) specified in Project Properties may be overwritten in reporting on report element level as described under Map View reporting option (see ‘Option #4’ tab details). 4.26.3.6 Automated Sector Coloring
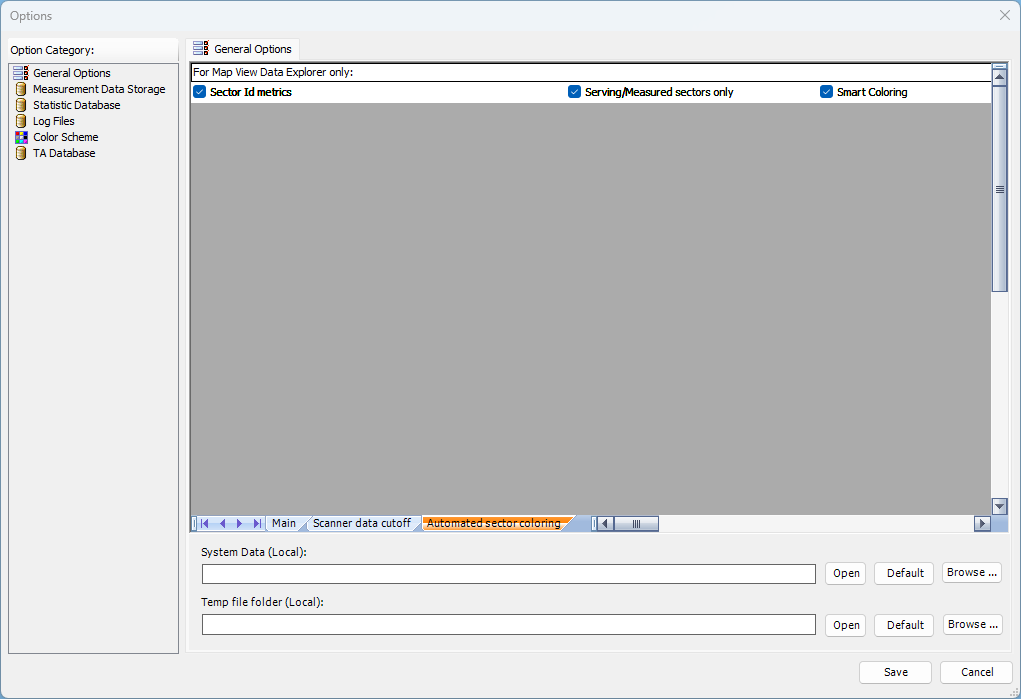
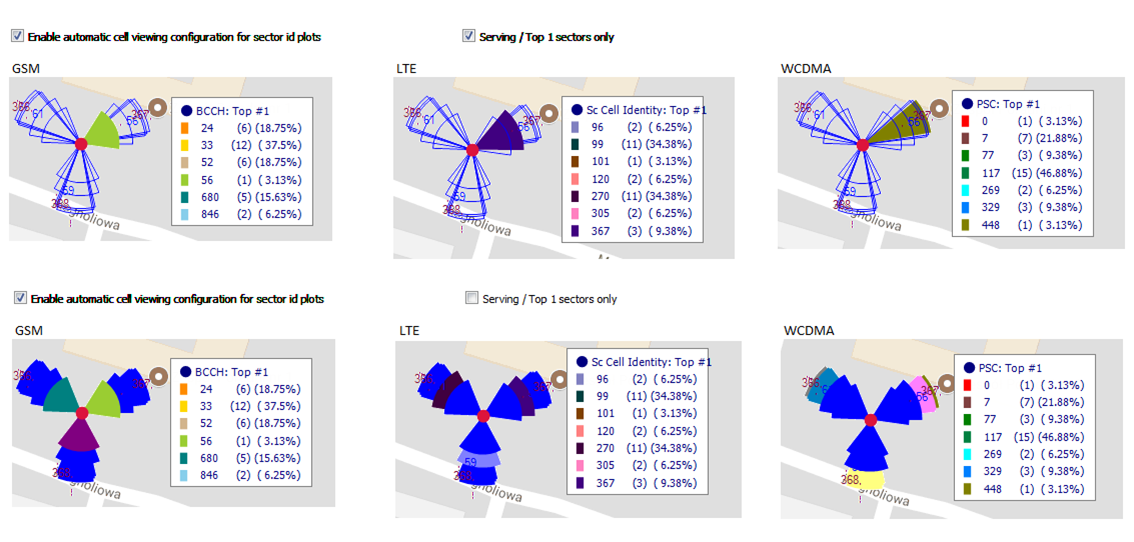
Automated sector coloring option will apply pre-defined cell configuration viewing settings to selected NR, LTE, WCDMA and GSM scanner and UE sector-id metrics. Automated sector coloring may be applied to Data Explorer Map View as well as Report Builder Map View (i.e. measurement report output). Automated sector coloring for Data Explorer Map View is enabled from Configuration | General Options | Automated sector coloring tab.
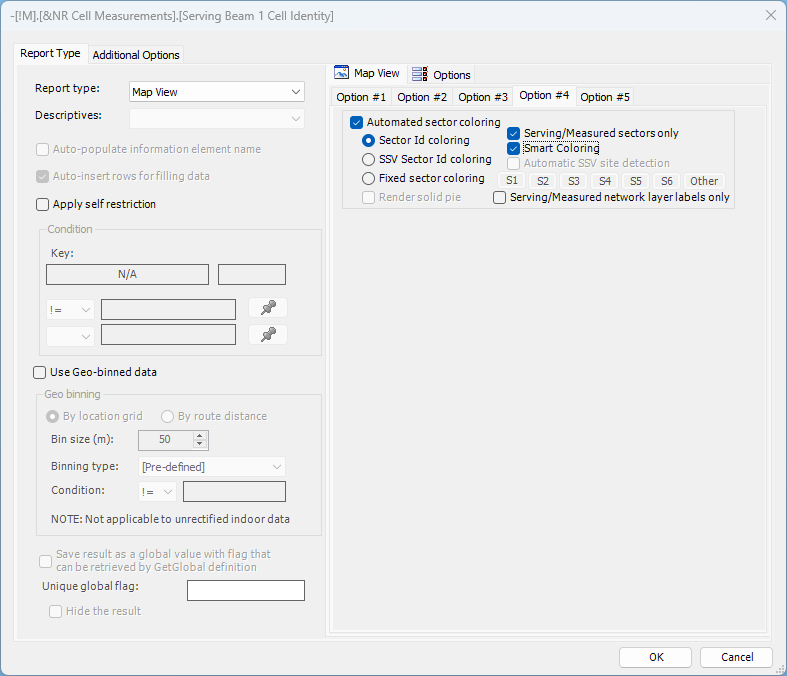
Automated sector coloring for Report Builder Map View is enabled directly from report element with scope of configuration limited to given reporting element. Automated sector coloring reporting option, besides the standard (‘Sector Id coloring’), includes additional ‘SSV Sector Id coloring’ and ‘Fixed sector coloring’ options. For more information see under
Map View reporting option ( ‘Option #4’ tab details).
The list of supported Sector Id metrics with respective plot band used for sector coloring is included in the table below.
Data frame | Metric | PlotBand |
GSM Cell Info Scanning | BCCH | ARFCN |
GSM Network Search | BCCH | ARFCN |
GSM Received Signal Level | BCCH | ARFCN |
GSM Received Signal Level | BCCH - .Server | ARFCN |
GSM Selected ARFCN Scanning - All Bands | Scanned ARFCN | ARFCN |
GSM Serving Info | BCCH ARFCN | ARFCN |
GSM Top ARFCN Scanning - All Bands | ARFCN | ARFCN |
GSM Top BCCH/BSIC Scanning - All Bands | BCCH | ARFCN |
GSM Top C/I Scanning | BCCH | ARFCN |
GSM Worst BCCH/BSIC Scanning - All Bands | BCCH | ARFCN |
NR Cell Measurements | Serving Beam 1 Cell Identity | NRCI |
NR Cell Measurements | Serving Beam 2 Cell Identity | NRCI |
NR Cell Measurements | Serving Beam 3 Cell Identity | NRCI |
NR Cell Measurements | Serving Beam 4 Cell Identity | NRCI |
NR Cell Measurements | Serving Beam 5 Cell Identity | NRCI |
NR Cell Measurements | Serving Beam 6 Cell Identity | NRCI |
NR Cell Measurements | Serving Beam 7 Cell Identity | NRCI |
NR Cell Measurements | Serving Beam 8 Cell Identity | NRCI |
NR Cell Measurements | Serving Cell Identity | NRCI |
NR Cell Scan - All NRARFCNs | Sc Cell Identity | NRCI |
LTE Cell Info Scanning | Sc Cell Identity | PCI |
LTE Cell Scan - All EARFCNs | Sc Cell Identity | PCI |
LTE NB Cell Info Scanning | Sc Cell Identity | PCI |
LTE NB Cell Scan - All EARFCNs | Sc Cell Identity | PCI |
LTE Serving/Intra-Freq Neighbor Cells | Cell Identity | PCI |
LTE Serving/Intra-Freq Neighbor Cells | Secondary Serving Cell 1 Identity | PCI |
LTE Serving/Intra-Freq Neighbor Cells | Secondary Serving Cell 2 Identity | PCI |
LTE Serving/Intra-Freq Neighbor Cells | Secondary Serving Cell 3 Identity | PCI |
LTE Serving/Intra-Freq Neighbor Cells | Secondary Serving Cell 4 Identity | PCI |
LTE Serving/Intra-Freq Neighbor Cells | Serving Cell Identity | PCI |
WCDMA Cell Info Scanning | PSC | PSC |
WCDMA Cell Measurements | Categorized PSC:A1 | PSC |
WCDMA Cell Measurements | Categorized PSC:A2 | PSC |
WCDMA Cell Measurements | Categorized PSC:A3 | PSC |
WCDMA Cell Measurements | Categorized PSC:A4 | PSC |
WCDMA Cell Measurements | Categorized PSC:A5 | PSC |
WCDMA Cell Measurements | Categorized PSC:A6 | PSC |
WCDMA Cell Measurements | Ranked PSC | PSC |
WCDMA PSC Scanning - All UARFCNs | PSC | PSC |
WCDMA PSC Scanning Sort by Ec/Io - All UARFCNs | PSC | PSC |
‘Sector Id coloring’ option will be applied if following conditions are fulfilled:
• ‘Sector Id metrics‘ check box is selected under Configuration | General Options | Automated sector coloring for Data Explorer Map View; For reporting option, ‘Sector Id coloring‘ check box of selected Map View reporting element is selected under ‘Option #4’ tab.
• Sector Id metric is added to Data Explorer Map View or Report Builder Map View element in case of reporting option.
• Sector Id metric occupies top mapping layer. In case of reporting option, Sector Id metric is added last to Map View element if more than one metric is present.
• Respective cell configuration information is available (e.g. LTE sector-id metric requires presence of LTE cell configuration layer). Sector information may be present in more than one cell configuration (e.g. one cell configuration per RAT).
• ‘Serving/Measured sectors only’ sub-option limits sector coloring to serving (applicable to UE measurements only) or measured (Top Nth) sectors identified in selected dataset and remaining sectors rendered with the blue outline to make serving/measured sectors stand out, otherwise entire selected entire respective radio technology sector layer will be colored (e.g. LTE sectors will be colored as per PCI plot band) while default/user defined cell viewing settings will be used for other RAT sectors.
• ‘Smart Coloring’ sub-option may be used to prevent color collisions in automated sector coloring by dynamically assigning limited set of colors (i.e. “smart colors”) to highest ranked serving/measured sectors in lieu of using fixed plotband color assignment. Use of ‘Smart Coloring’ is conditioned on enabling of ‘Serving/Measured sectors only’ sub-option.
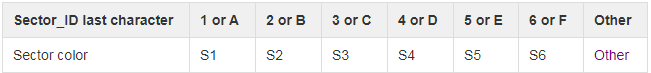
‘Fixed sector coloring‘ option is available in reporting only and is applied unconditionally to all RAT layers:
• Users may define custom sector color for up to 6 logical sectors per site by adhering to the following naming convention:
• ‘Other’ color selection may be used as a wildcard for exceptional sites (e.g. out of cluster sites)
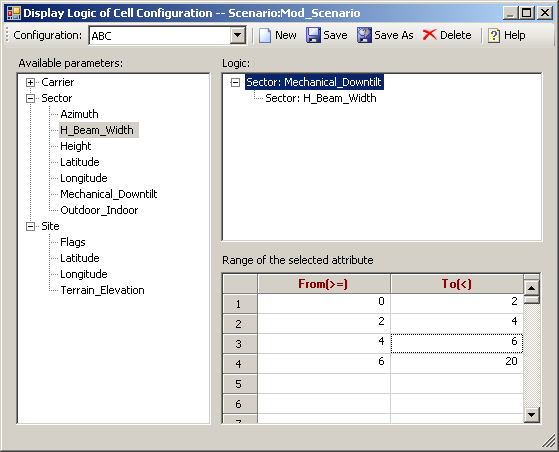
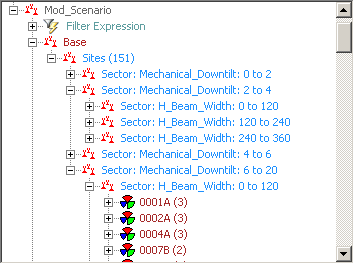
4.26.3.7 Cell Site Grouping Logic
The cell sites listed in
Data Explorer–Cells can be grouped with user-defined grouping logic for better data organization. To do this, right click a scenario version in
Data Explorer–Cells and select
Edit Grouping Logic from the menu.
Drag-and-drop a parameter from the tree view on the left side into the Logic pane on the right side. For each parameter, define its range in the spreadsheet. Multiple parameters can be dragged into Logic pane, and their levels can be modified by dragging-and-dropping them to the desired level. All configurations can be saved with a name.
From
Data Explorer–Cells, right-click a scenario version and select
Apply Grouping Logic from the menu. The name of the configuration and the logical display of cell configuration will refresh and be grouped as defined, as shown below:
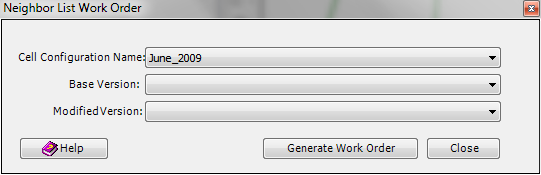
4.26.3.8 Neighbor List Work Order
After using the Neighbor List Editing tools in the Map View (see
Cells in Map View for more information) to modify the neighbor list, you can generate a work order and save it to a file.
To access the Neighbor List Work Order dialog, click the
NL Word Order button

in the
Data Explorer–Cells toolbar.
You can select a cell configuration and generate a neighbor list work order based on two versions. After the work order is generated, click Save to File to save the result to an Excel file or a tab-delimited text file.
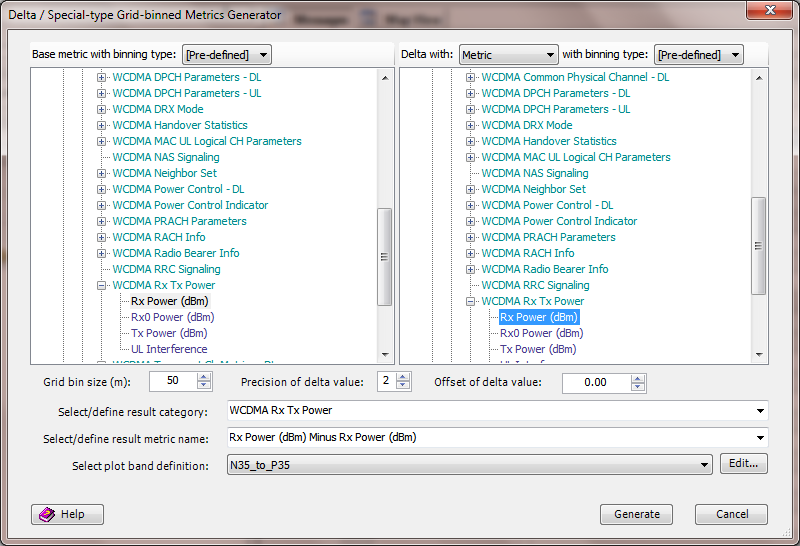
4.26.4 Delta/Special-type Grid-binned Metric
TEMS Discovery provides an easy approach to generating delta metrics between any given metric pair or metric-coverage map pair or generating grid-binned metrics with a user-defined binning type. The option is available for outdoor and rectified indoor datasets.
The Delta/Special-type Grid-binned Metrics Generator can be accessed as follows:
• Clicking the
Delta/Special-type Grid-binned Metric 
button in the Data Explorer–Dataset toolbar.
• Right-clicking any metric in the
Data Explorer, and selecting the
Generate Delta/Special-type Grid-binned Metric option.
After the delta metric is generated, it will be listed under the Delta/Special-type Grid-binned Metric tree node in the Data Explorer–Dataset. This delta/special metric can be displayed in the Map View, Table View, Report View, etc., as are other geo-binned metrics.
Normally, when generating delta metrics, you would select [Pre-defined] as the binning type, which is the aggregation method pre-defined in TEMS Discovery by the nature of the data. However, you have the option to overwrite this default aggregation method by selecting any other from the combo box. The available binning types are: AVG, LAVG, MIN, MAX, COUNT, SUM, FIRST, and LAST.
After you select a base metric in the right panel, go to the combo box labeled
Delta with: and select the option to generate delta with another metric, with coverage map (see
Import Coverage Map), or with
None. If
None is selected, TEMS Discovery will actually perform geo-location binning for the selected base metric with the selected binning type. You can also add an offset to the result of each bin so that you can create more meaningful metrics.
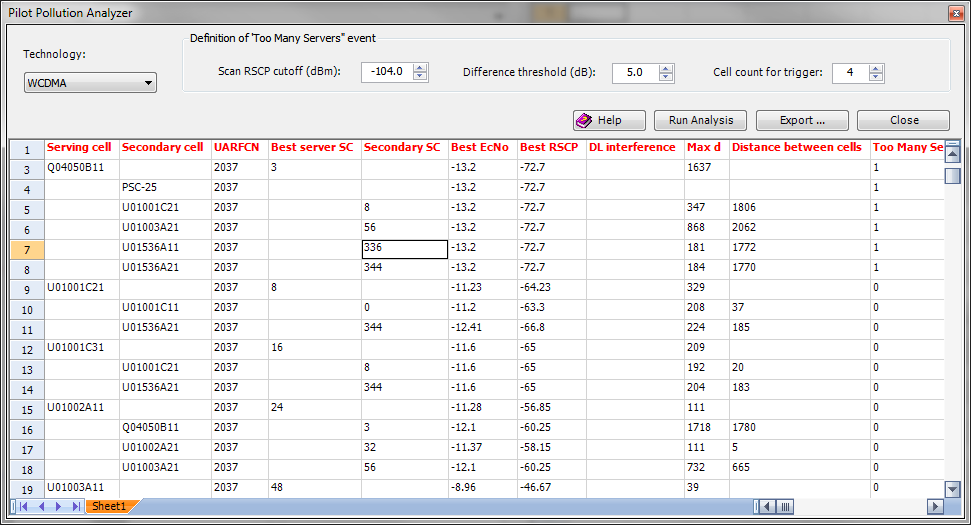
4.26.5 Pilot Pollution Analysis
Pilot pollution analysis can be run from selected scanner data, and the data can be listed according to serving cell and secondary cell combinations.
The Pilot Pollution Analyzer can be accessed from the context menus on the
Project List or the
Data Explorer. • Best EcNo. The strongest EcNo (dB) recorded for the serving cell across all bins in which the respective serving cell and secondary cell were seen together.
• Best RSCP. The strongest RSCP (dBm) recorded for the serving cell across all bins in which the respective serving cell and secondary cell were seen together.
• DL interference. The mean downlink interference reported by the scanner across all bins in which the respective serving cell and secondary cell were seen together.
• Max d. The maximum distance (meters) reported between the measured BIN and the secondary cell, across all bins in which the respective serving cell and secondary cell were seen together.
• Distance between cells. The distance (meters) between the serving cell and the respective secondary cell.
• Too many servers event count. The number of Too many server events was triggered across all bins in which the respective serving cell and secondary cell were seen together. The definition for Too many server can be configured as shown in user interface.
• Distance samples. The number of distance measurement samples were recorded in which the respective serving cell and secondary cell were seen together.
d < 1000, 1000 < d < 5000, d > 5000
For each particular serving cell and secondary cell combination, this value shows what percentage of distance measurement samples fell within a particular range (meters) of the serving cell.
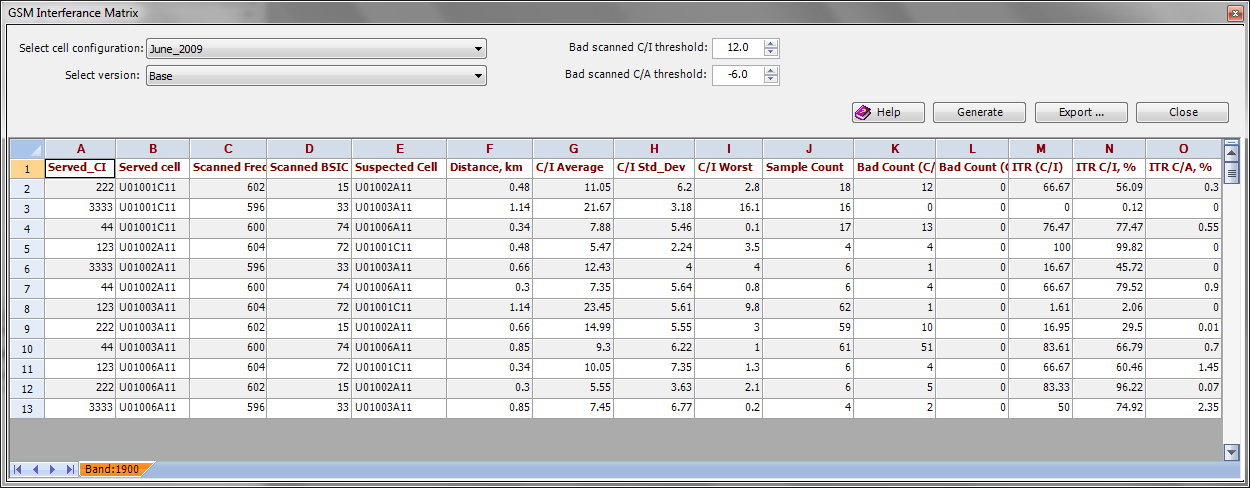
4.26.6 GSM Interference Matrix
A GSM interference matrix can be generated from selected scanner data while the serving sector is determined from phone data, and the data can be listed according to serving cell and suspected cell combinations.
The GSM Interference Matrix can be accessed from the context menus on the
Project List or the
Data Explorer.
• Distance, km. The distance between the serving cell and the suspected cell
• C/I Average. The C/I average of all bins in which the respective serving cell and suspected cell were seen together.
• C/I Std_Dev. The C/I standard deviation of all bins in which the respective serving cell and suspected cell were seen together.
• C/I Worst. The worst C/I of all bins in which the respective serving cell and suspected cell were seen together.
• Sample Count. The count of all bins in which the respective serving cell and suspected cell were seen together.
• Bad Count (C/I). The count of the bins in which the respective serving cell and suspected cell were seen together and C/I is less then threshold.
• Bad Count (C/A). The count of the bins in which the respective serving cell and suspected cell were seen together and C/I is less then threshold.
• ITR C/I. Interference traffic rate
• ITR C/I, %. The lost traffic percentage for serving sector due to co-channel interference.
• ITR C/A, %. The lost traffic percentage for serving sector due to adjacent channel interference.


 button in the