1.3 Summary Data Views
The project workspace contains multiple views. All of the views provide various data presentations for analyzing and troubleshooting visually and efficiently. The views are categorized as
synchronizable views and
summary data views.
Summary views are the views that present statistic data in various formats. Summary views include:
1.3.1 Histogram

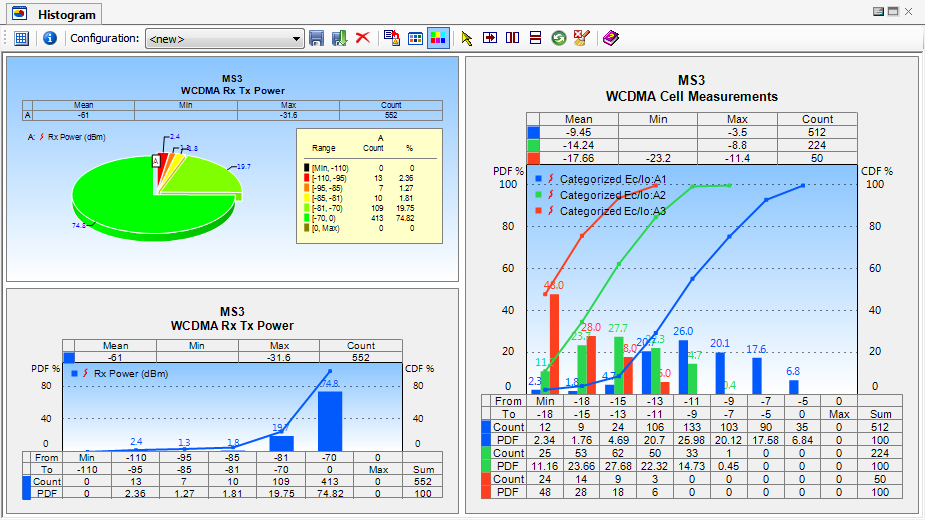
The Histogram View is for graphical display of metric data showing the proportion of data that falls into each specific plot band. To display data in the Histogram, drag-and-drop the metric data object from the
Data Explorer into the Histogram View, or right-click the metric data object and choose
Send to Histogram from the pop-up menu.
The graphical display of metric data can be shown as a bar graph, a 2D pie chart, or a 3D pie chart; all options can be freely converted from one to the other.
Histogram Toolbar
| Table Size. Display a Table Size selector for creating multiple Histograms.
The Histograms are always in sync. |
Combo box | List the available configurations. Each configuration defines the collection of metrics to be loaded and in which Histogram to load them. |
| Save Configuration. Save the current metric configuration. |
| Save Configuration As. Save the current metric configuration as a new configuration. |
| Delete Selected Configuration. |
| Export Statistic Data to a Text File. |
| View Option. Open the Histogram View Option dialog. See Histogram View Options for more information. |
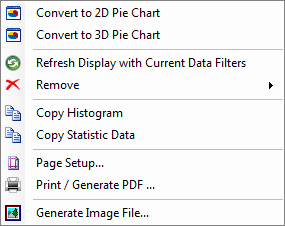
| Pointer. Change the cursor to a pointer. Right-clicking the screen will bring up the following pop-up menu: | Convert to 2D Pie Chart. Convert the current display to a 2D pie chart. Convert to 3D Pie Chart. Convert the current display to a 3D pie chart. Refresh Display with Current Data Filters. Apply the new data filtering options and refresh the display. Remove. Remove a particular chart from the display. Copy Histogram. Copy the current display to the Clipboard to paste it outside of TEMS Discovery. | Copy Statistic Data. Copy the current display statistic data to the Clipboard to paste it outside of TEMS Discovery. Page Setup. Page setup for printout or PDF generation. Print / Generate PDF. See Create Output. Generate Image File. See Generate Image File for more information. |
|
| Cell Merger Tool. Left-click, hold, and move the mouse to draw a rectangle to select the cells to be merged. Release the cursor to merge the cells into a single cell spanning multiple columns and rows. |
| Split Merged Cell in Horizontal Direction. Click the cell created with the Cell Merger tool to split it horizontally. |
| Split Merged Cell in Vertical Direction. Click the cell created with the Cell Merger tool to split it vertically. |
| Refresh Display to Apply Current Data Filters. Apply the new data filtering options defined in the Data Explorer and refresh the display. |
| Cleanup. Clean up the display. |
| Help. |
1.3.1.1 Histogram View Options
The Histogram view options dialog can be accessed by clicking the
View Options button

on the Histogram toolbar.
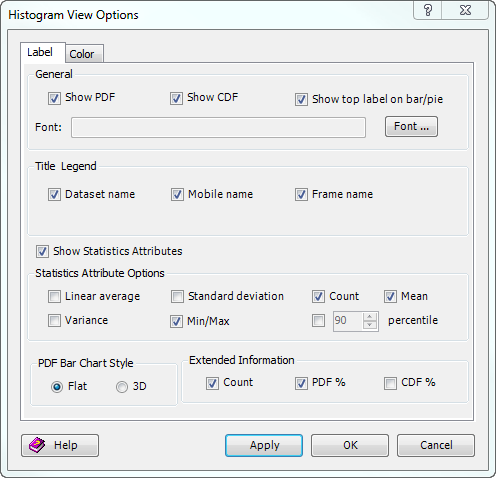
Label tab
• General. Select whether to display PDF, CDF, and/or top label on bar/pie. (The font for the label can be modified.)
• Title Legend. Select what to display in the title – dataset name, mobile name, and/or frame name.
• Statistic Attribute Options. Select the statistic attributes to be listed.
• PDF Bar Chart Style. Select a flat or 3D image.
• Bar Chart Extended Label. Select additional information to display – Count, PDF%, and/or CDF% (other than the plot band displayed at the bottom of the bar chart).
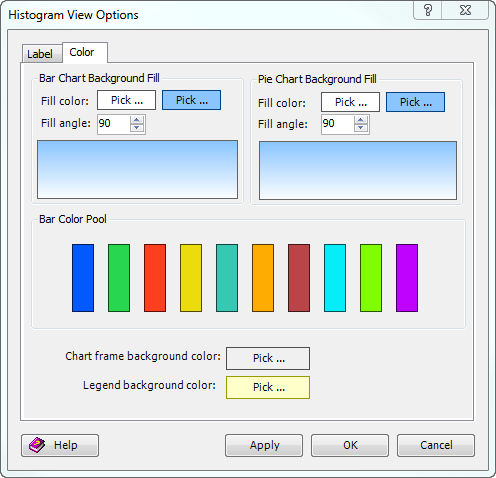
Color tab
• Bar Chart Background Fill. The background of bar chart can be in filled as a gradient to visually enhance presentation. You can define the start and end colors, and the fill angle. Click the color bar to select a color.
• Pie Chart Background Fill. The background of the bar chart can be in-filled as a gradient to visually enhance presentation. You can define the start and end colors, and the fill angle. Click the color bar to select a color.
• Bar Color Pool. The color(s) of the bar chart can be picked from this color pool.
Click the color bar to select a color.
• Chart frame background color. Select the background color for the chart frame.
Click the color bar to select a color.
• Legend background color. Select the background color for the legend.
Click the color bar to select a color.
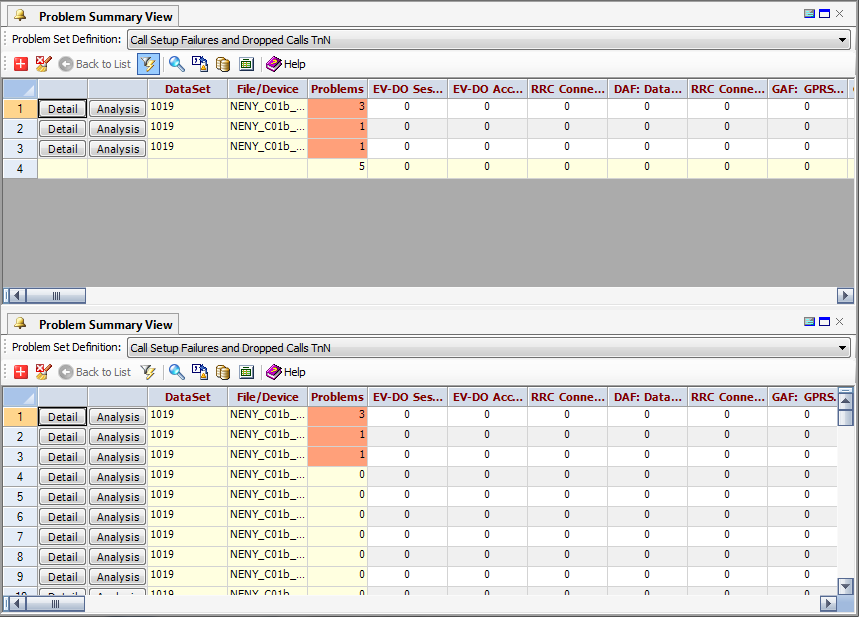
1.3.2 Problem Summary View

The Problem Summary View lists the problem summary of devices based on pre-defined problem sets (see
Report Template Builder for how to define problem sets). If a device has problems, its background color will be orange. Otherwise, the background color of the rows will be displayed in the normal alternating, shaded format.
You can send a set of devices from the
Project List or
Data Explorer either by dragging-and-dropping them into Problem Summary View or by selecting them from the context menu. All of the devices will be listed with the number of the problems and their detail problem information in a tabular format.
Click the
Problem Only filter button

on the toolbar to list the devices with problems, or select a different problem set definition from the combo box to refine the list. You can also click the
Detail button to view the details of a problem of a particular device, or the
Analysis button to analyze the device.
If any problem count displayed in a cell is actually the count of an event that is defined in a script, and this event has an analysis set associated with it (see
Script Builder for detail), you can simply double-click that cell and TEMS Discovery will automatically open the analysis view based on the associated analysis set.
All problem information can be saved to an Excel file. You can also create a composite dataset from what is displayed in the spreadsheet, or simply generate a report from the data.
Problem Summary View Toolbar
| Create New Problem Summary View |
| Cleanup. Clean up the spreadsheet. |
| Back to List. Go back to the list of devices. |
| Problem Only. List only the devices with problems. |
| Analyze. Analyze the selected problem (selected cell) if the problem has an associated Analysis Set defined in the Script Builder. |
| Save to File. Save the problem summary to a text file. |
| Create Composite Dataset. Create a composite dataset from the devices listed in the spreadsheet. |
| Generate Report. Generate a report from the devices listed in the spreadsheet. |
| Help. |
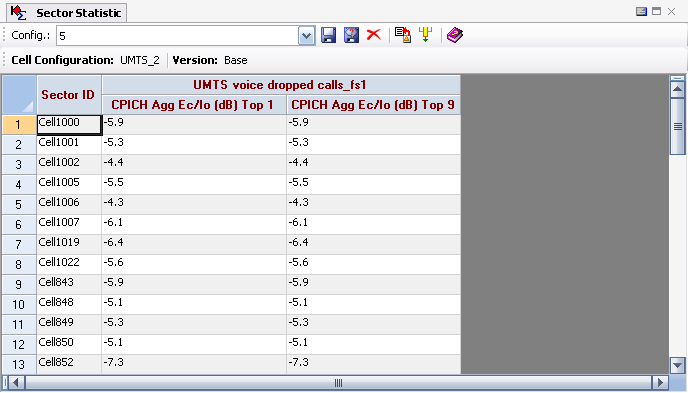
1.3.3 Sector Statistics View

The
Sector Statistics View displays a metric per sector binning; its functions are similar to those of the
Table View. To display data in the Sector Statistics View, drag-and-drop the metric data object from the
Data Explorer into the Sector Statistics View, or right-click the metric data object and choose
Send to Sector Statistics View from the pop-up menu.
Sector Statistics View Toolbar
Combo box | Lists the available configurations. Each configuration defines the collection of metrics to be loaded. |
| Save Configuration. Save the currently displayed metric and its location as a configuration. |
| Save Configuration As. Save the current metric configuration as a new configuration. |
| Delete Configuration. Delete the current configuration. |
| Cleanup. |
| Export to Text File. Export the displayed statistic data to a tab-delimited text file. |
| Remove Columns. Delete the selected column and its corresponding statistic data from spreadsheet. |
| Help. |
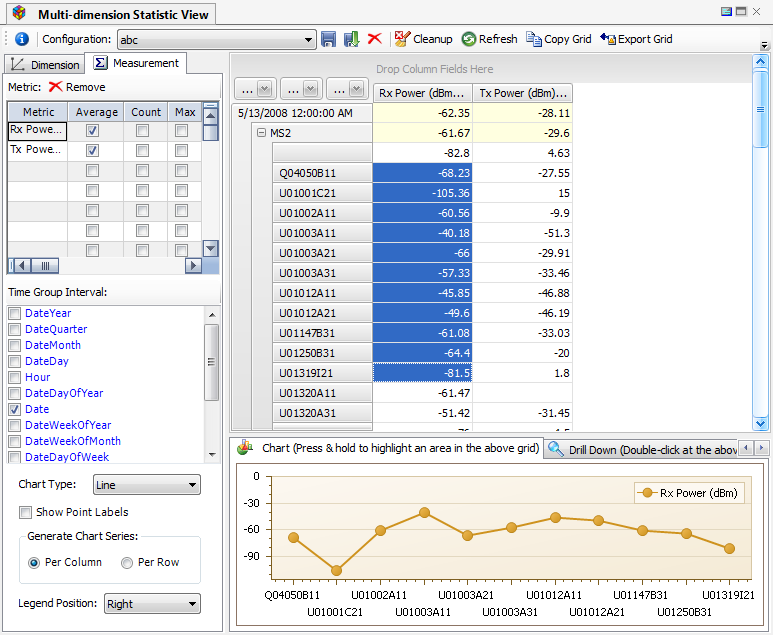
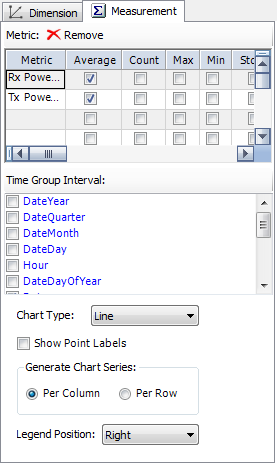
1.3.4 Multi-dimension Statistic View

The
Multi-dimension Statistic View displays on-demand statistic data of multiple metrics in multiple user-selected dimensions.
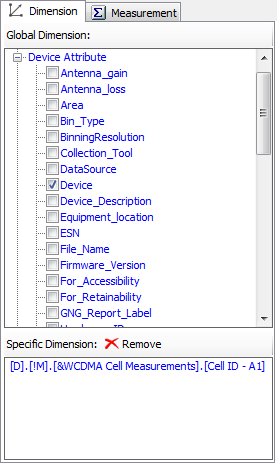
To create an on-demand Multi-dimension Statistic View, you may:
1. Select any number of pre-defined global dimensions (device attributes, cell configuration, or UDR attributes) in the Dimension tab.
2. To define a specific dimension using other metric data, you may drag-and-drop one or many metrics from the
Data Explorer into the specific dimension box. You can remove a specific dimension by pressing the
Delete 
button on the toolbar.
3. Drag-and-drop one or many metrics from the
Data Explorer into the grid or chart control in the right pane to display the view. You can remove a measurement by pressing the
Delete button on the spreadsheet toolbar.
4. Select Aggregation Methods for each measurement; select Time Group Interval and other options in the Measurement tab. Aggregation methods include Average, Count, k-thPercentile Max, Min, StdDev, StdDevp, Sum, Var and Varp statistical options. k-thPercentile calculation will report metric value which is higher than ‘k’ percents of metric values, so it will produce median value for user-configurable parameter k set to 50 (default).
If you modify any display options, be sure to press the
Refresh 
button on the toolbar to refresh the display.
To visualize statistics data in a chart, you can select a desired data area on the grid by clicking and holding the left mouse button.
To drill down to the detail of what contributes to the statistics data, click a cell in the grid, and a list of files will be listed in the spreadsheet. You can save the list to a file, create a composite dataset from the list, or generate a report from the list. All of the data can be exported to an external file.
The display options can also be saved as a configuration and re-used.
As an alternative, you can right-click the metric data object in the
Data Explorer and choose
Send to Multi-dimension Statistic View from the pop-up menu. See
Data Explorer for more information.
Multi-dimension Statistic View Toolbar
Combo box | Lists the available configurations. |
| Save Configuration. Save the currently displayed metric and its location as a configuration. |
| Save Configuration As. Save the current metric configuration as a new configuration. |
| Delete Configuration. Delete the current configuration. |
| Cleanup Grid. |
| Refresh. Refresh the data. |
| Copy Grid. |
| Export Grid. Export the grid data or chart to an external file. |
| Help. |