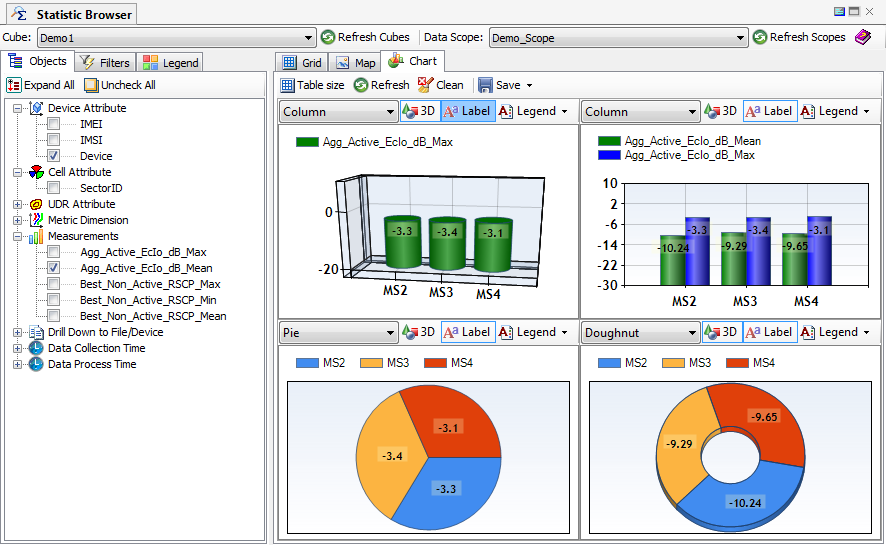
 With the Cube Viewer, you can browse statistic data in various presentations. With the Cube Viewer, you can browse statistic data in various presentations.
  to present the data in the selected view.
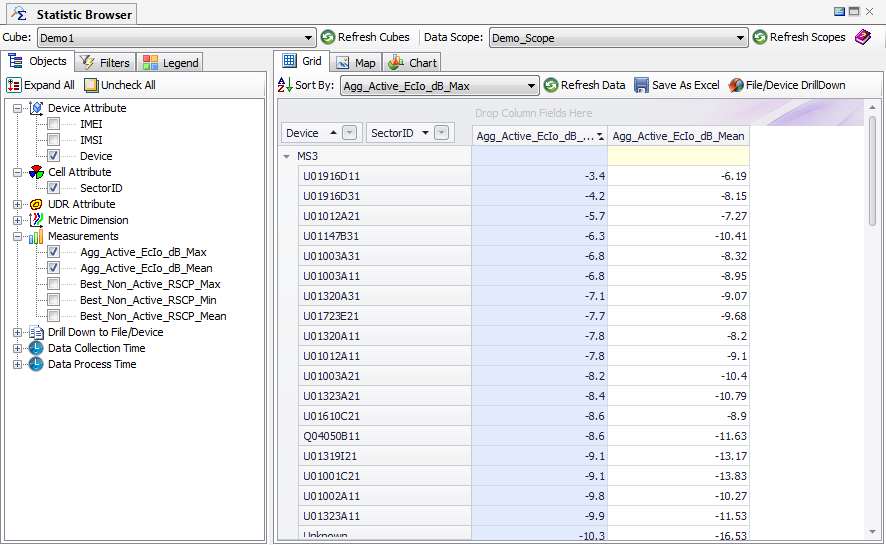
Filtering You can filter the displayed data. All available filtering dimensions for the selected cube are listed in the upper pane of the Filters | Dimension tab. by Dimension: Once a dimension is checked, the available values for that dimension will be listed in the lower pane. You can select any one of them as a filter. by Date: You can also filter data based on the time range. | 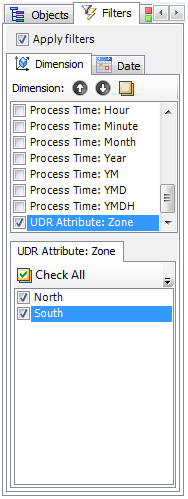 | 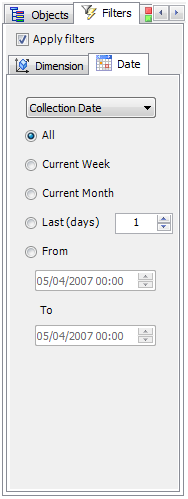 |
 | Refresh Data. Apply the new data selection and refresh the display. |
 | Save As Excel. Save the current display as an Excel file. |
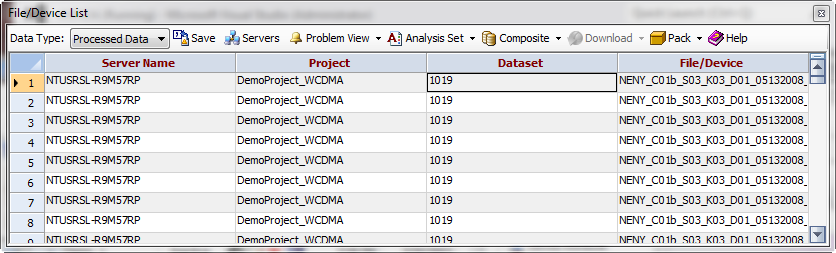
 | File/Device Drilldown. Bring up the File/Device List. Then, double-click any of the cells in the grid to list the contributed file/device in the dialog. Each row in the spreadsheet lists the processed file/device and the location (data source) of that file/device. See File/Device Drilldown. |
 | Help. |
 | Table Size Selector. Display the Table Size selector for creating multiple Map Views. Multiple views can be synchronized by clicking the Synchronization button  . . |
| Save. Save all the currently displayed views, or save an individual view as an image. |
| Turn On/Off Subview Synchronization Mode. Synchronize all Map subviews created by the Table Size button . |
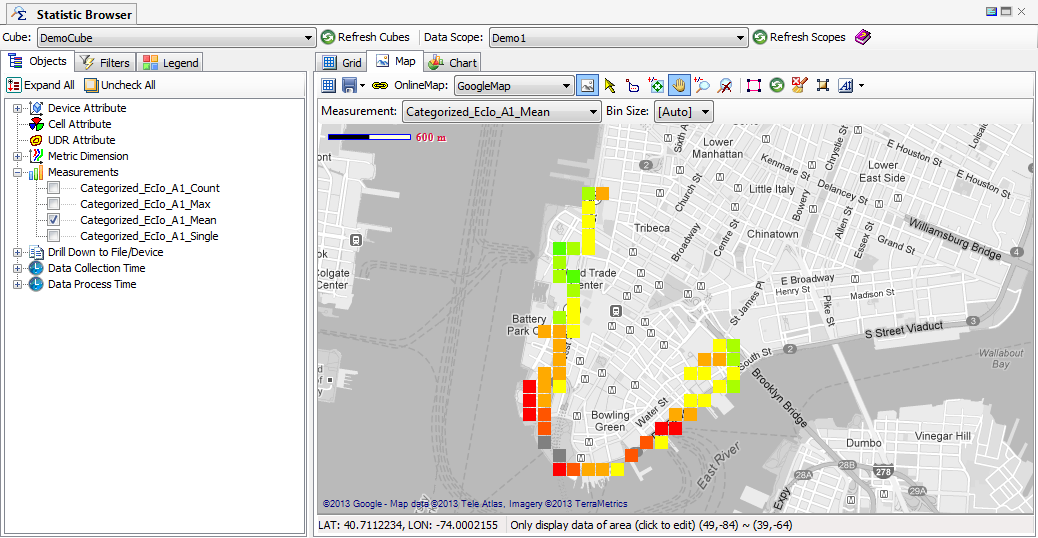
Combo box | OnlineMap. List the available online map data source that you have been licensed. |
 | Draw GIS in Grayscale. Display the GIS image in grayscale. |
 | Pointer. Change the cursor to a pointer. |
 | List of File/Device Contribute to Area Bin. Bring up the File/Device list. Click at any area bin in the Map View to list the contributed file/device to the dialog. Each row in the spreadsheet lists the processed file/device and the location (data source) of the file/device. See File/Device Drilldown. |
 | Reset. |
 | Pan. Pan view to user-selected direction and distance. |
 | Zoom In/Out: 1. To zoom in, left-click the desired location, which will be used as the center for the zoom in. 2. To zoom out, right-click the location, which will be used as the center for the zoom out. 3. Left-clicking and holding will draw a rectangle that will zoom in the view port to the area within the rectangle. 4. Right-clicking and holding will draw a rectangle that will zoom out of the view port to that area within the rectangle. |
 | Unzoom. Undo the last zoom action. Clicking the Reset button will clear the history of previous zoom actions. |
 | Define Statistic Data Area. Only the statistic data in the defined area with Geo center defined in “Cube Data Scope Configurations” will be loaded and displayed in Map View. This area can also be defined in options |
| Refresh Data. Apply the new data selection and refresh the display. |
 | Clean. Clean up the display. |
 | UDR Polygon Selector. |
 | Data Label. Display value of data points in the screen. |
| Table Size. Display the Table Size selector for creating multiple Map Views. Multiple views can be synchronized by clicking the Synchronization button . |
| Refresh. Apply the new data selection and refresh the display. |
| Clean. Clean up the display. |
| Save. Save all the currently displayed views, or save an individual view as an image. |
 | Save. Save the list to an Excel file. |
 | Remote Servers. The Remote Data Sharing Servers dialog lists all remote servers that can be accessed for peer-to-peer data sharing. If you want to download the listed file/device, make sure the according server (data source) is in your remote server list. |
 | |
 | Analysis Set. Open analysis set to analyze all files or multiple selected files. |
 | Composite. Create new composite dataset from all files or multiple selected files, or add all files or multiple selected files to an existing composite dataset. |
| Download. If TEMS Discovery detects that the data source is located in a remote server, it will download the selected file/device and list the data in the Project List with the same data structure as that in the remote server. |
 | Pack. If TEMS Discovery detects that the data source is located in the local machine, rather than downloading measurement data from a remote server, it will pack the selected file/device to a zip file for sharing. |