Clicking the Expand button  will expand the entire tree view.
will expand the entire tree view. will expand the entire tree view. will collapse the tree view.
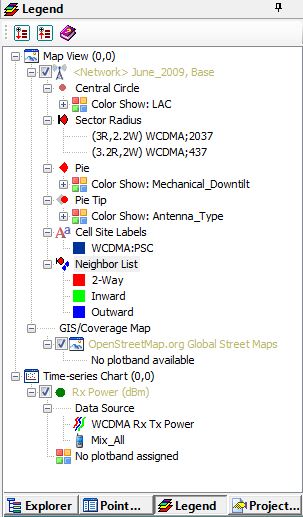
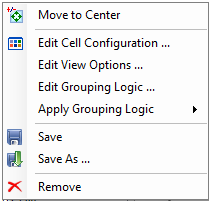 | Move to Center. Move the bounding rectangle of the displayed version of cell sites to the center of the Map View. Edit Cell Configuration. Open the Cell Configuration Editor. Edit View Options. Open the Cell Configuration View Options dialog. Edit Grouping Logic. Open the Cell Site Grouping Logic dialog dialog. Apply Grouping Logic. Apply a certain grouping logic to refresh the logical display of the selected version of cell sites. Save. Save the version of cell sites to a file. Save As. Save the version of cell sites as a new cell site configuration. Remove. Remove the corresponding cell configuration display from the Map View. |
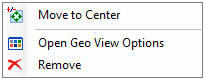 | Move to Center. Move the bounding rectangle of the displayed GIS data to the center of the Map View. Open Geo View Options. Open the Map View Options dialog. Remove. Remove the corresponding GIS map display from the Map View. |
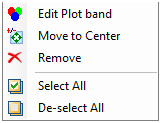 | Edit Plot Band. Edit the plot band of the metric. Move to Center. Move the bounding rectangle of the displayed metric to the center of Map View. Remove. Remove the corresponding metric display from the Map View. Select All. Select all plot bands so that all data will be displayed in the Map View. De-select All. De-select all plot bands so that no data will be displayed in the Map View. |
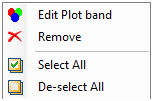 | Edit Plot Band. Edit the plot band of the metric. Remove. Remove the metric from the Time Chart. Select All. Select all plot bands so that all data will be displayed in the Time Chart. De-select All. De-select all plot bands so that no data will be displayed in the Time Chart. |