73.5 Examples of Bar Chart Presentations
Single IE
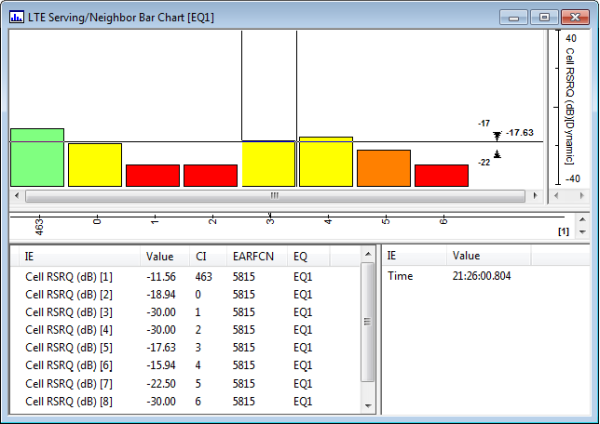
Single IE presentation: LTE serving and neighbor RSRQ (dB).
Multiple IE Components
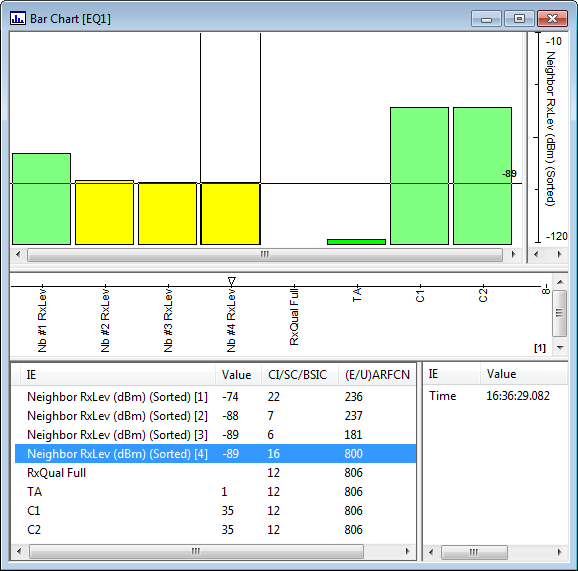
Multiple IE Components presentation displaying an assortment of single-value IEs and selected components of multivalue IEs, and with user-defined text labels added on the x-axis.
Stacked Bar Chart, Parallel Coordinates
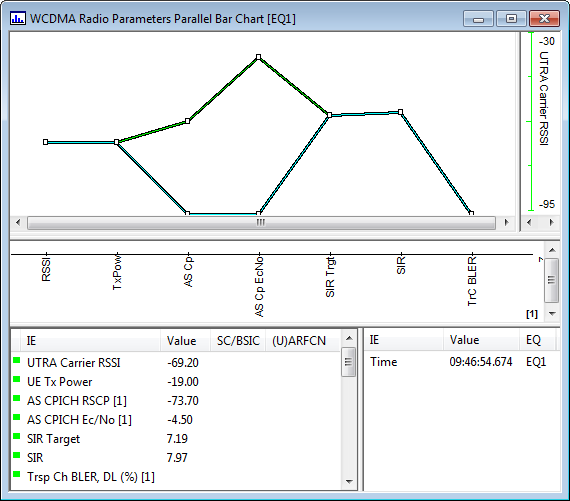
Parallel coordinates presentation (the predefined "Radio Parameters Parallel Bar Chart" for WCDMA). Each point on the horizontal axis represents a network parameter, and the colored lines, each connecting a set of parameter values, represents a moment in time. This arrangement allows the user to spot instantaneously any pattern that is out of the ordinary (that is, any unexpected line shape).