74.2.3 Presenting Information Elements
In the Theme Settings dialog, select one of the layers (or create a new layer to put the theme in: see section "Layers").
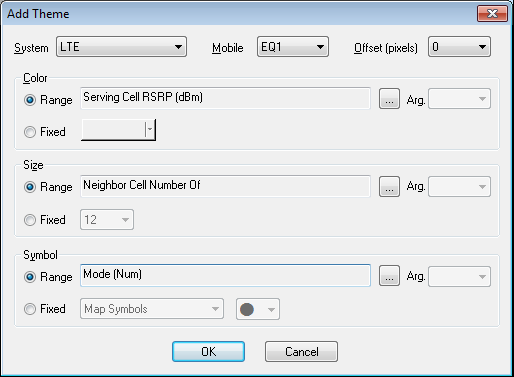
Click Add Theme:
|
System |
Choose an information element category. See Information Elements and Events, chapter "Information Element Categories". |
|
Mobile |
Choose the device from which to pick the information element. |
|
Offset (pixels) |
This setting decides how far from its true position on the map the theme marker will be drawn. The offset direction is at right angles to the direction of travel; a positive offset is to the right relative to the direction of travel. Using offsets enables you to display several routes side by side. |
|
Color |
In this section you specify a rule for the theme marker color: Choose Range to have the color governed by an information element. Select an element, and select an argument if applicable. Choose Fixed to use a fixed color. This means, of course, that the color will not carry any information. |
|
Size |
In this section you specify a rule for the theme marker size, in the same way as for the color. See above. |
|
Symbol |
In this section you specify a rule for choosing the shape of the theme marker, in the same way as for the color. If you choose Fixed, pick a font in the first combo box, then pick a symbol in the second. |
74.2.3.1. Notes on Route Plotting and Updating
Interpolation. Map positions, whether delivered by a GPS or pinpointed, are constantly interpolated (linearly) to enable plotting at half-second intervals. However, whether markers are actually plotted at this rate depends on other circumstances. See below.
Arrival of new measurement data. A new theme marker is plotted only if a message with fresh data has been delivered by the measurement device. Updates will thus be less frequent in idle mode than in dedicated mode. Note also that certain information elements are not updated regularly at all but only on special occasions (for example, when the device switches to a different RAB). If you want to plot such an IE with high frequency, include another IE that is frequently updated in the same theme.
Loss of positioning data. If GPS data is lost for an extended period of time (for instance while driving through a tunnel) but GPS coverage is eventually regained, positions will still be interpolated and plotted throughout the gap. On the other hand, if no more positioning data is obtained, interpolation is of course impossible, and no extrapolation of the route is attempted by TEMS Investigation.
Map zoom. The plotting density on the map is dependent on the current zoom of the Map window. When you zoom in, more markers are filled in to show the route in more detail; when you zoom out, markers are drawn more sparsely. Specifically, a new theme object (whether a symbol or a line) is drawn next to the latest one if the centers of the two objects will be more than 5 pixels apart on the screen.
Pin Pointing. The plotting of the routes between pin points is not done during logfile recording, information will only be displayed for the pin pointed spots. The route between them will be plotted (and visible) when replaying the logfile.