72.4.3 Editing the Contents of a Chart
Select the chart you want to edit in the list box.
Click Edit Chart.
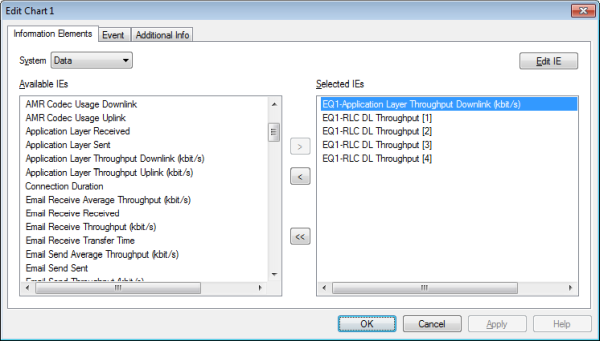
Information Elements Tab
First select information element category in the System combo box. See Information Elements and Events, chapter "Information Element Categories".
Using the arrow buttons, move the elements you want to present from the Available IEs to the Selected IEs list box. A maximum of seven elements can be presented. You can use the Ctrl and Shift keys to select multiple items in the boxes.
if the element has an argument, it is taken from the same device as before, and the value with the next higher argument is shown;
otherwise, the element is taken from the next device.
|
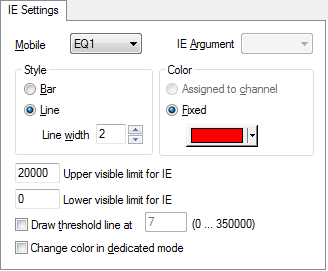
Mobile |
The device to pick the information element from. Note that it is possible to change the device for all chosen elements at once. See section "Presenting Data from a Different Device". |
|
IE Argument |
The argument (if any) of the information element. |
|
Style: Bar |
Choose this if you want the element to be plotted as successive, tightly packed vertical bars. |
|
Style: Line |
Choose this if you want the element to be plotted as a line. You can adjust the line width. |
|
Color: Assigned to channel |
This option is available only for elements made up of sorted channel lists (e.g. neighbors, scanned channels). If it is chosen, the application automatically assigns a color on the basis of what channel is shown. The point of this is to ensure that you can easily see when the sort order of the list (e.g. the neighbor ranking) changes. As far as possible, one and the same color is used throughout for a given channel. |
|
Color: Fixed |
This option is available for all elements, and consists simply in your selecting one fixed color yourself. |
|
Upper visible limit for IE |
Upper limit of the value range shown for this information element. That is, this setting adjusts the range in the Y-axis pane. For complex information elements, the limit is automatically changed for all other arguments as well. |
|
Lower visible limit for IE |
Lower limit of the value range shown for this information element. This setting works the same way as Upper visible limit for IE. |
|
Draw threshold line at |
Check this if you want to compare the plotted values with a threshold line drawn at a specified value. |
|
Change color in dedicated mode |
This option is available only when a fixed color is used for plotting. If you check this option, the plot color will turn deeper when the device enters dedicated mode, and the brighter color chosen in the Color box is reserved for idle mode. (The dedicated mode color is not user-customizable.) |
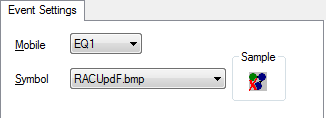
Events Tab
Using the arrow buttons, move the events you want to present to the Selected Events list box.
|
Mobile |
The device to pick the event from. |
|
Symbol |
The image file used to label the vertical line indicating the event. |