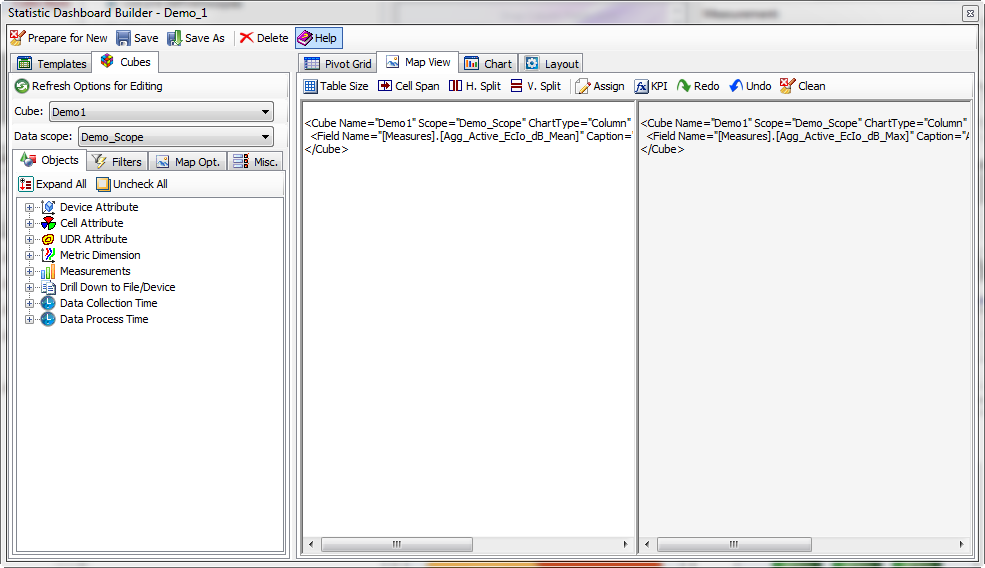
3.5 Statistic Dashboard Builder

The Statistic Dashboard Builder is a user interface that builds a template that contains information about the view layouts and the content to be presented in each view. The available views are Pivot Grid View, Map View, and Chart View.
The Dashboard Builder can be accessed in the following ways:
• Selecting Dashboard Builder from the Statistic menu on the Main Window.
• Clicking the
Dashboard Builder button

on the Dashboard toolbar.
All available dashboard templates are listed in the Templates tab on the left pane. You can delete or edit those templates.
To start creating a new template, click the
Prepare for New button

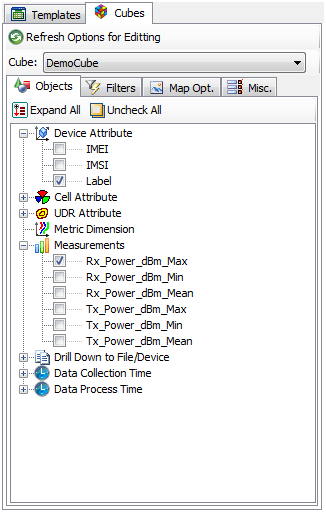
, which will clean up all assignments in the views on the right pane. Switch to the Cubes tab, select a cube, and then make the desired selections.
Pivot Grid View
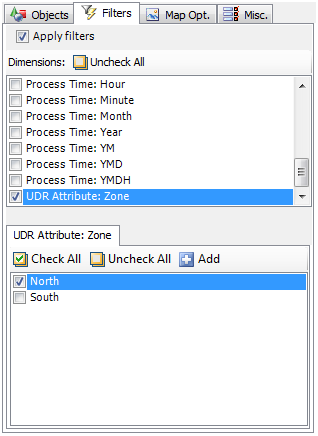
For the Pivot Grid view display, you can select one or more measurements and dimensions in the Object tab, apply a filter in the Filters tab, and then click the
Assign button
on the Pivot Grid tab to assign the definition string to the target grid view.
Map View
The Map View display has more options: Map Options and Miscellaneous Options.
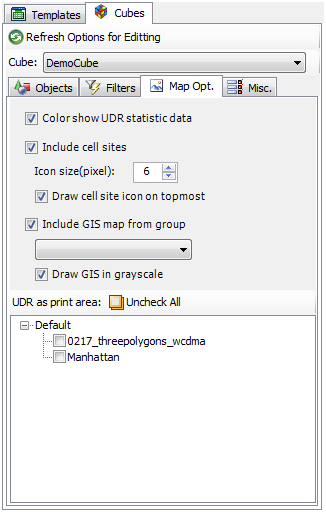
Map Options
• Color shows UDR statistic data. To use this option, you must select one UDR attribute as a dimension in the Objects tab. This option directs TEMS Discovery to draw the UDR polygon with the selected attribute, calculate the statistic data of each polygon, and then fill the polygon with the color determined by the plot band definition.
• Include Cell Sites. Based on the boundaries of the statistic data, this option directs TEMS Discovery to search the default network configuration list, locate all the cell sites within the boundary, and draw those cell sites in the Map View.
• Include GIS map from group. Based on the boundaries of the statistic data, this option directs TEMS Discovery to search the selected default GIS group, locate all the GIS data within the boundary, and draw that GIS data in the Map View.
• UDR as print area. This option selects a list of UDRs as a fixed print area. TEMS Discovery will determine the bounding rectangle of the selected UDRs and adjust the view port of the Map View accordingly.
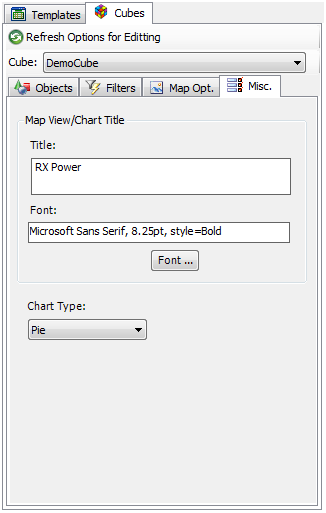
Miscellaneous Options
• Map View/Chart Title. Enter the text of your choice to define a title for the Map View or Chart.
• Font. Select the font for the text.
• Chart type. For Charts, select the chart type.
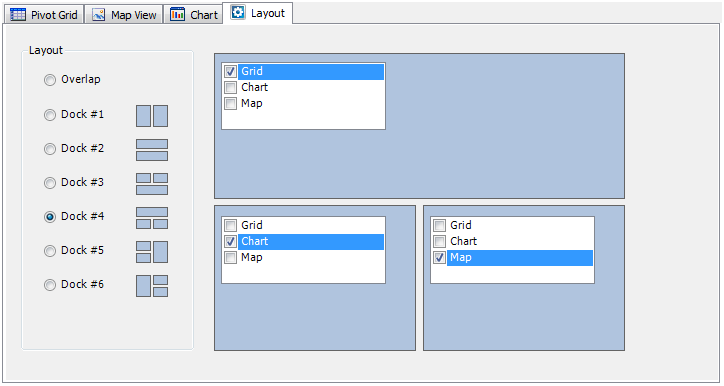
Layout
Use the options on the Layout tab to define the view layout.
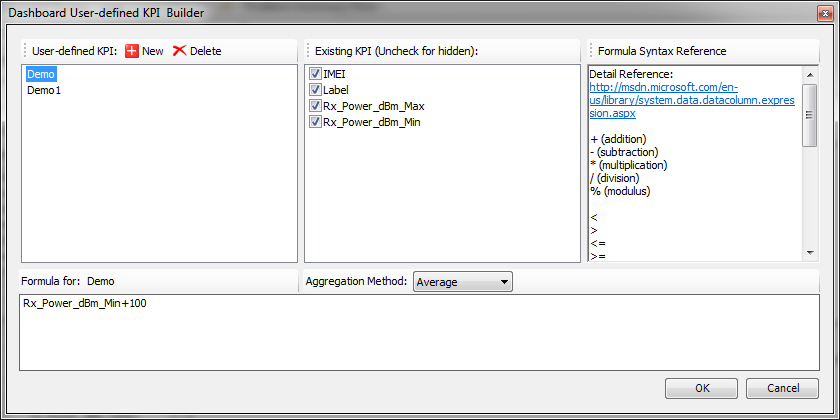
User-defined KPI
The user can create customize KPI from the pre-defined KPI.
For syntax reference, please visit pages below
3.5.1.1 Dashboard Builder Toolbars
| Prepare for New. Prepare for a new assignment. This cleans up all existing assignments and prepares for creation of a new template. |
| Save. Save the template. |
| Save As. Save the template as a new template. |
| Delete. Delete the selected template. |
| Help. |
Dashboard Builder Toolbar – View tabs
| Table Size. Define the number of subviews. |
| Move Field Down. In Grid view, you can move a measurement or dimension field up or down to change the order of the field in the grid. |
| Move Field Up. In Grid view, you can move a measurement or dimension field up or down to change the order of the field in the grid. |
| Cell Span. |
| Horizontal Split. |
| Vertical Split. |
| Assign. Assign the selected option as a definition for the view. |
| Create/Edit User-defined KPI. |
| Redo. Redo the previous modification. |
| Undo. Undo the previous modification. |
| Clean. Clean up. |